Статті
Data visualisation during wartime. Nadja Kelm`s speech at the data-journalisn conference in Finland
"For the last sixteen months, we have been working during the war and we have been telling about the war. None of us wanted to go through this, but it turned out to be a unique experience which I would like to share it with you" - this is how Nadja Kelm started her speech at the annual conference "Visualizing Knowledge", which has been held since 2012 in the capital of Finland. Since 2017, it has been organized by Aalto University. This year the name was "Visualizing Uncertainty".
We publish her speech below.
Читати українською
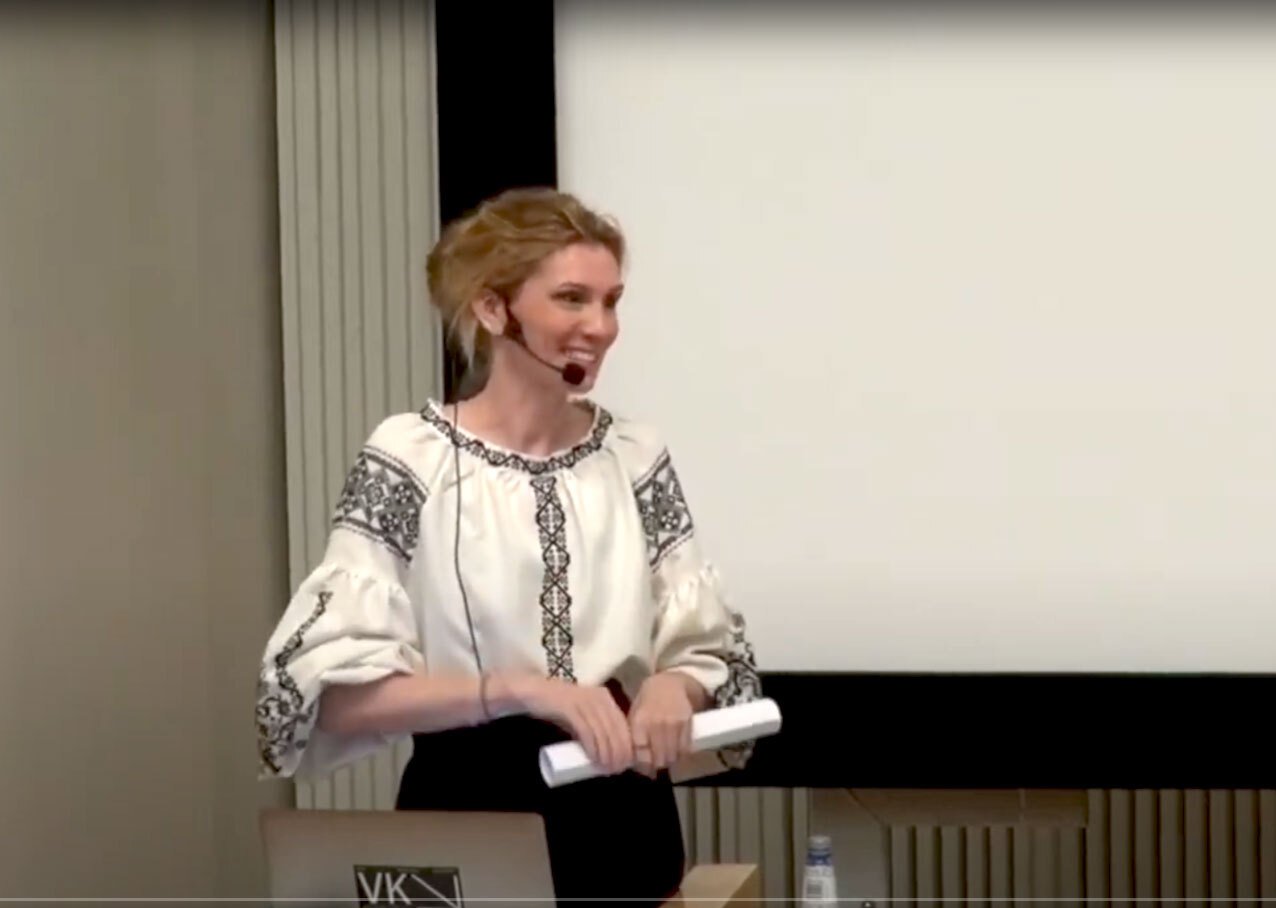
My name is Nadja Kelm, I'm from Ukraine and I visualise the data collected and analysed by Texty.org.ua — a small independent media based in Kyiv, Ukraine.
We create data journalism projects and work in traditional journalistic genres.
For the last sixteen months, we have been working during the war and we have been telling about the war.
None of us wanted to go through this, but it turned out to be a unique experience which I would like to share it with you.
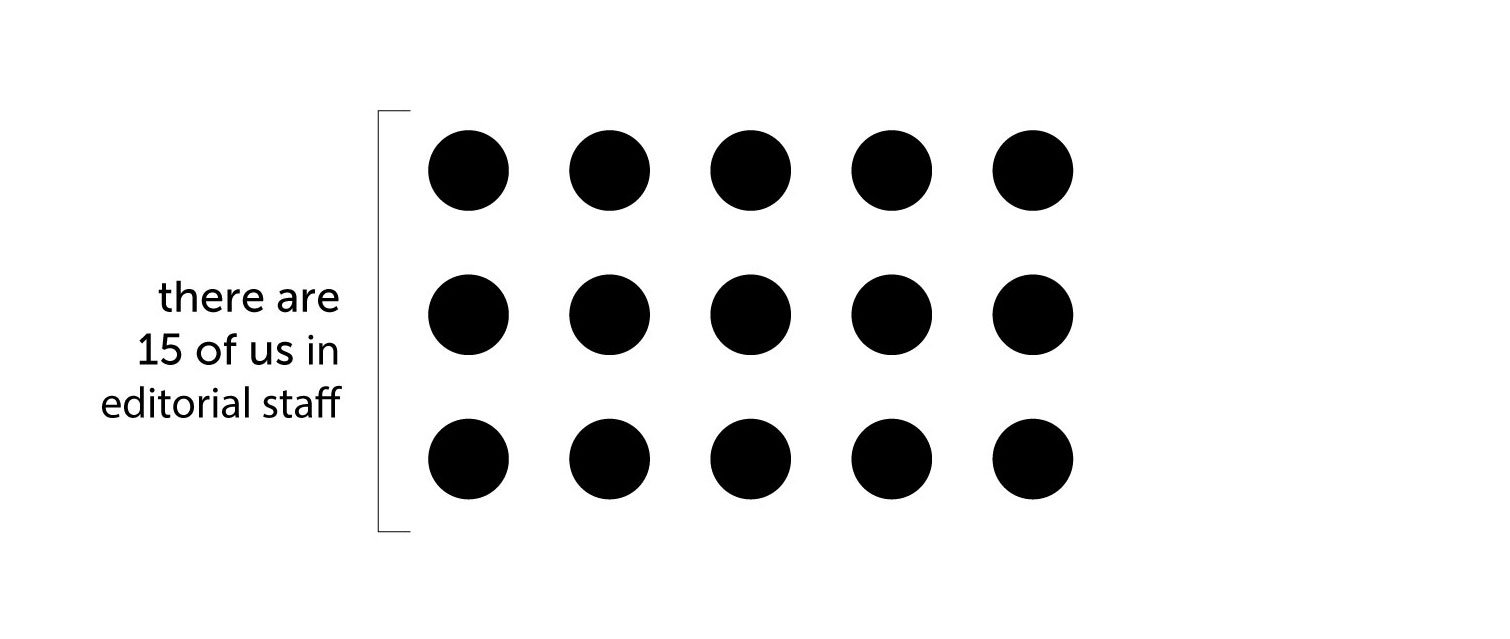
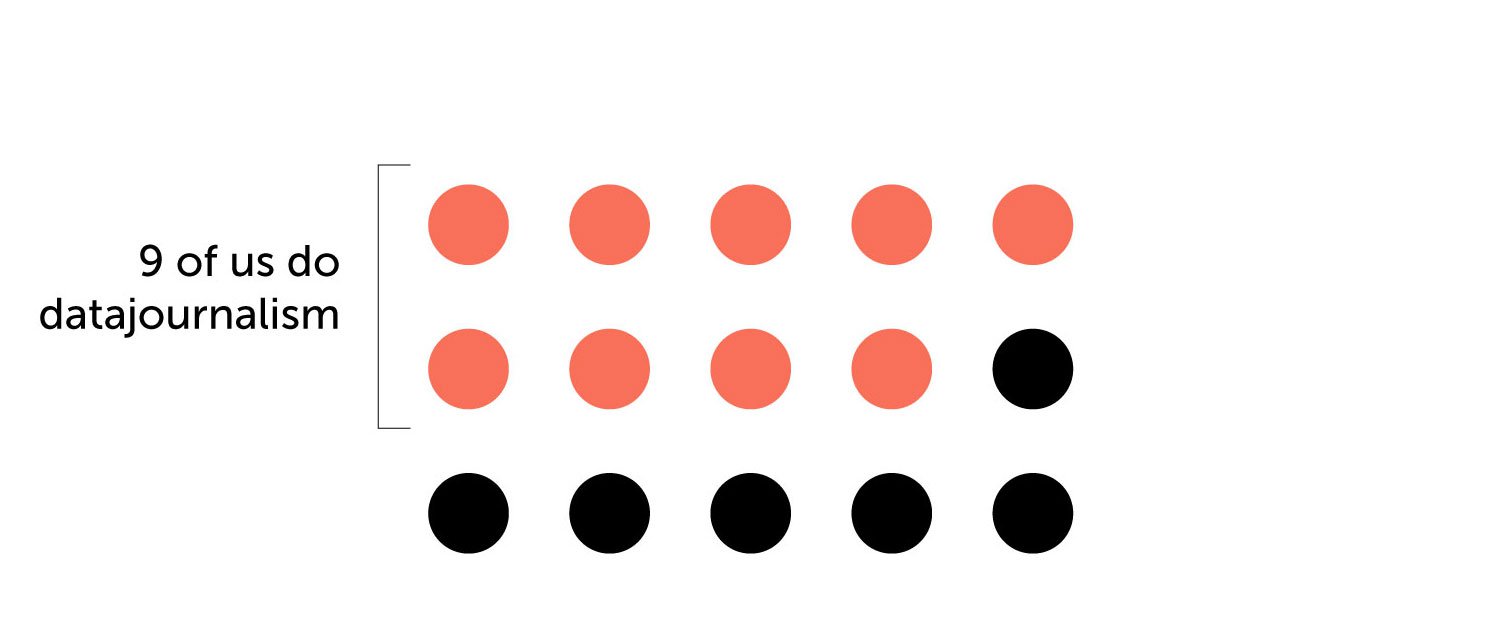
So, what is it like to work in the time of war? Some of my colleagues have joined the Armed Forces of Ukraine. Those who stayed have been working remotely. Many have relocated.
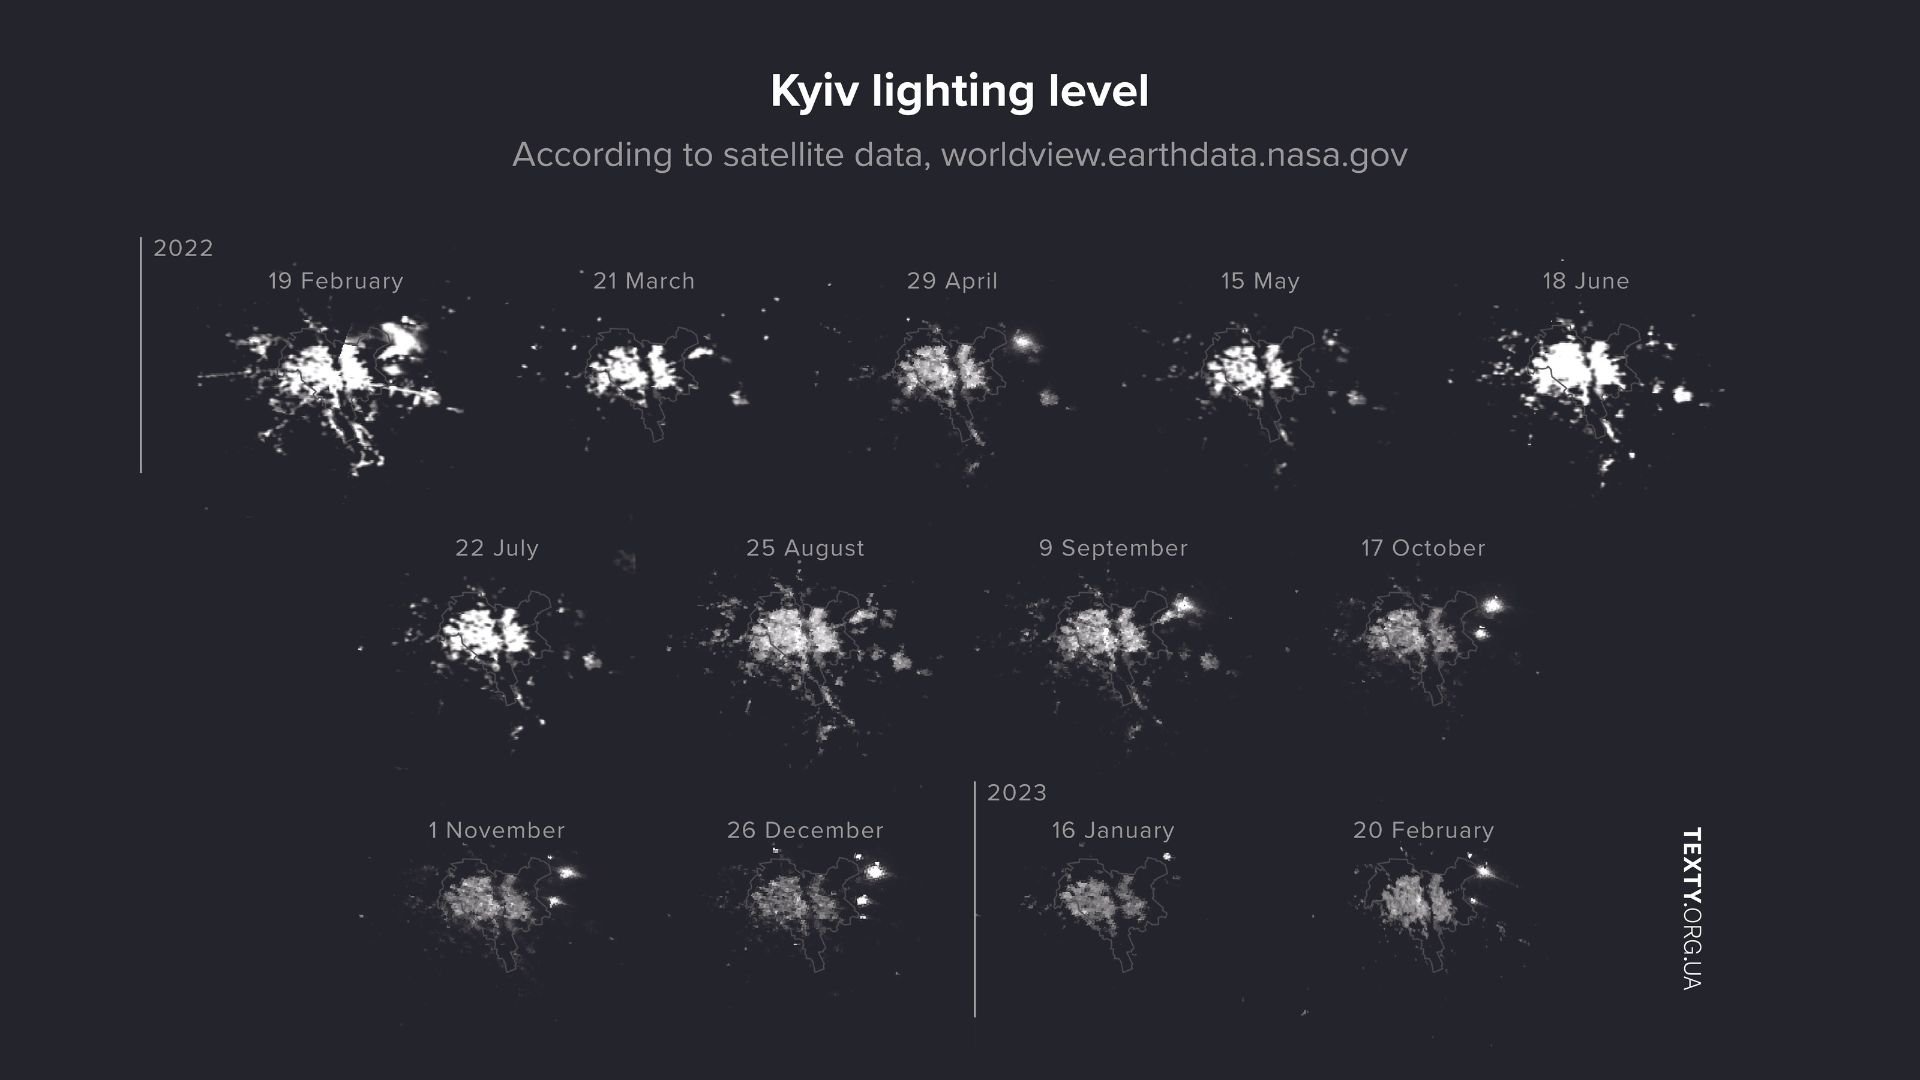
In addition to the general stress, we learned to adjust our schedules to air alerts and blackouts, because at some point, the government instructed the people to keep the lights low at night to confuse enemy pilots.
Data-project A year of full-scale war (in graphs)
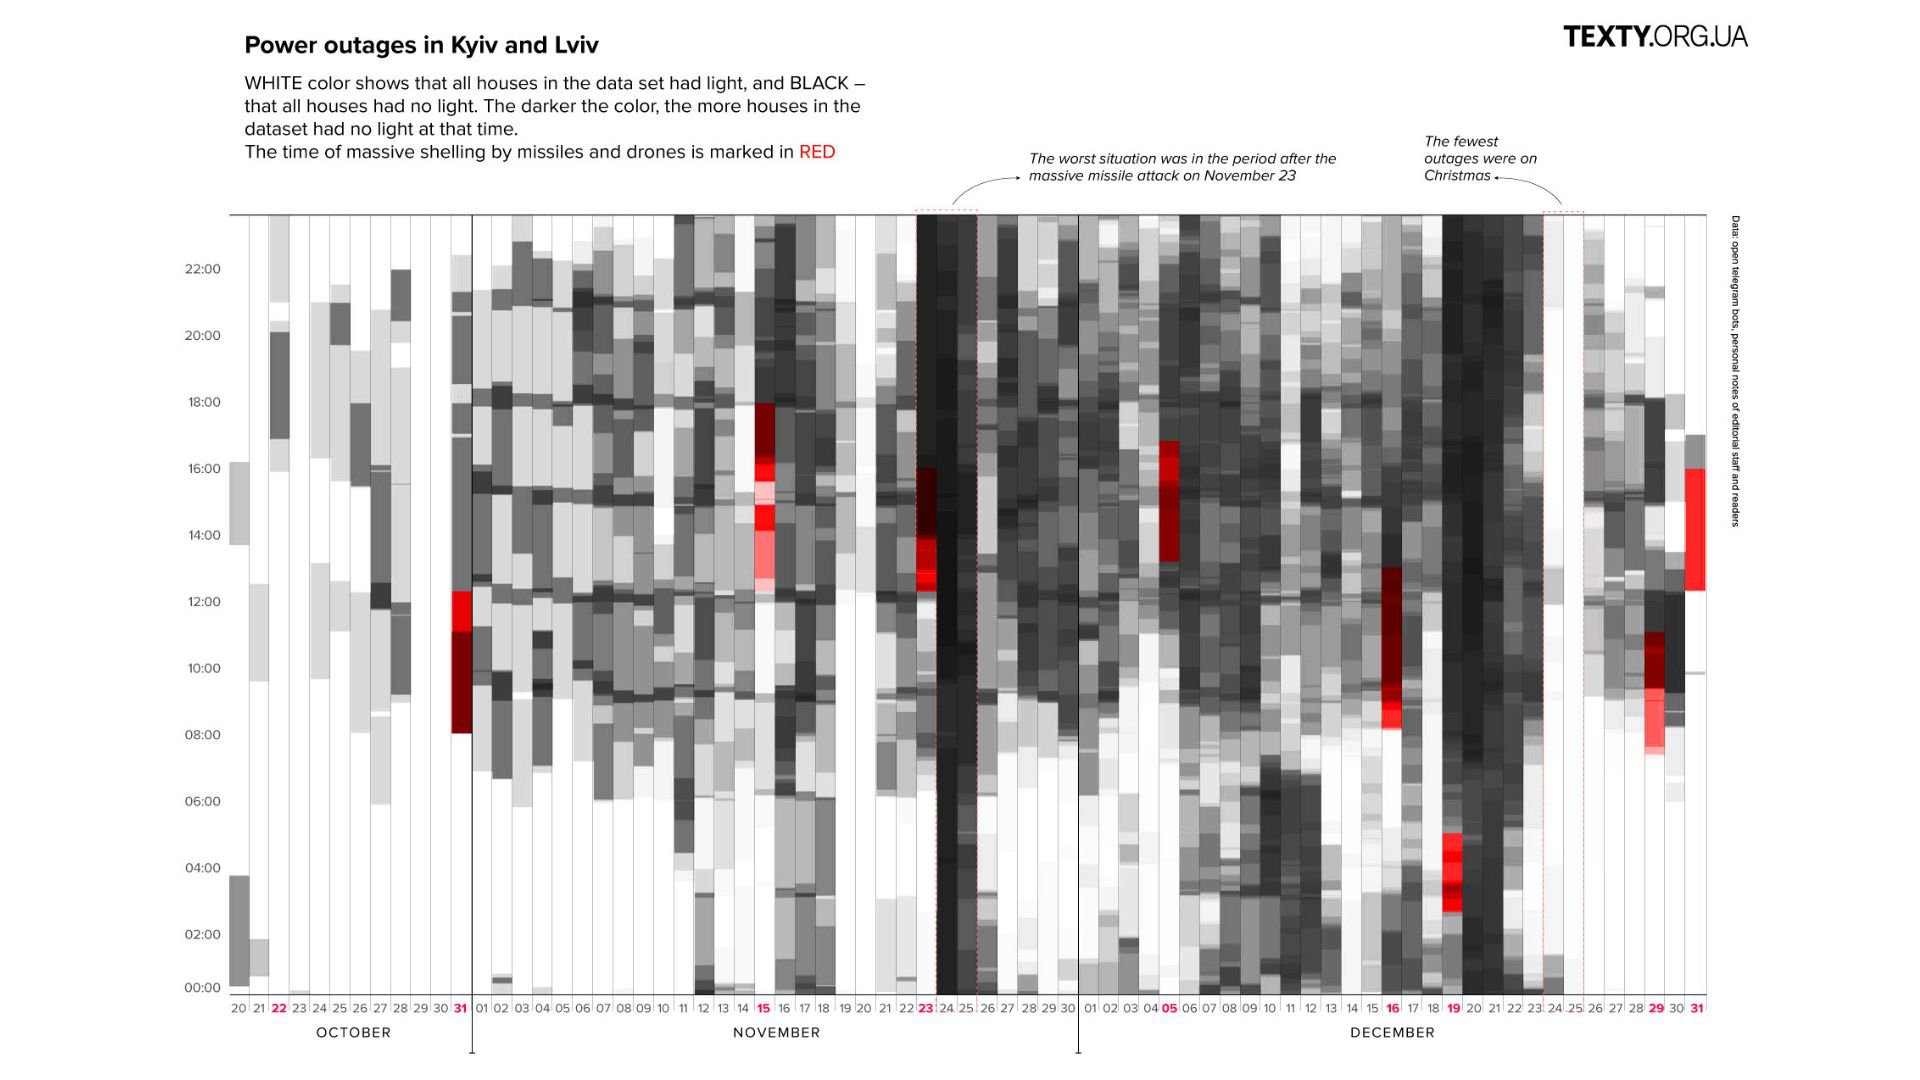
Then we had to get really creative during the outages after missile attacks had crippled Ukraine’s power grid.
In the picture above their pattern is in the bottom line.
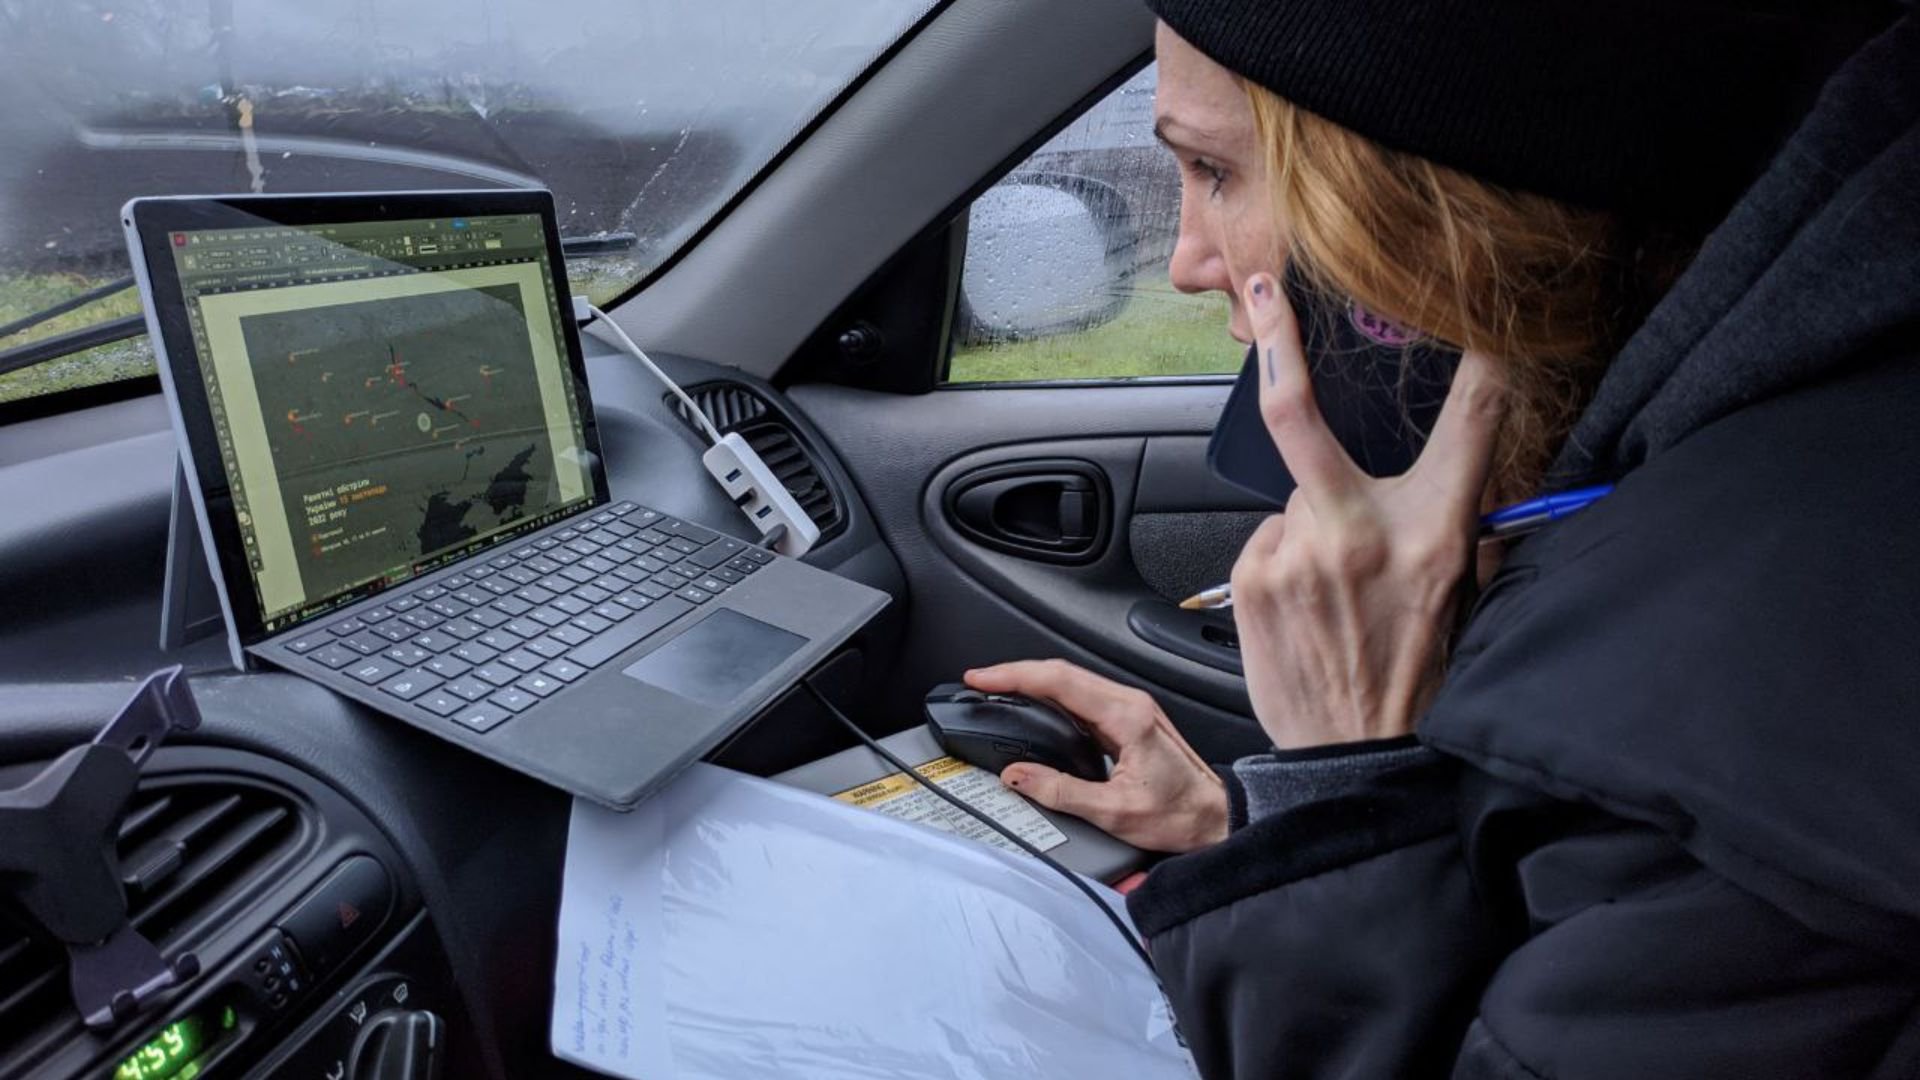
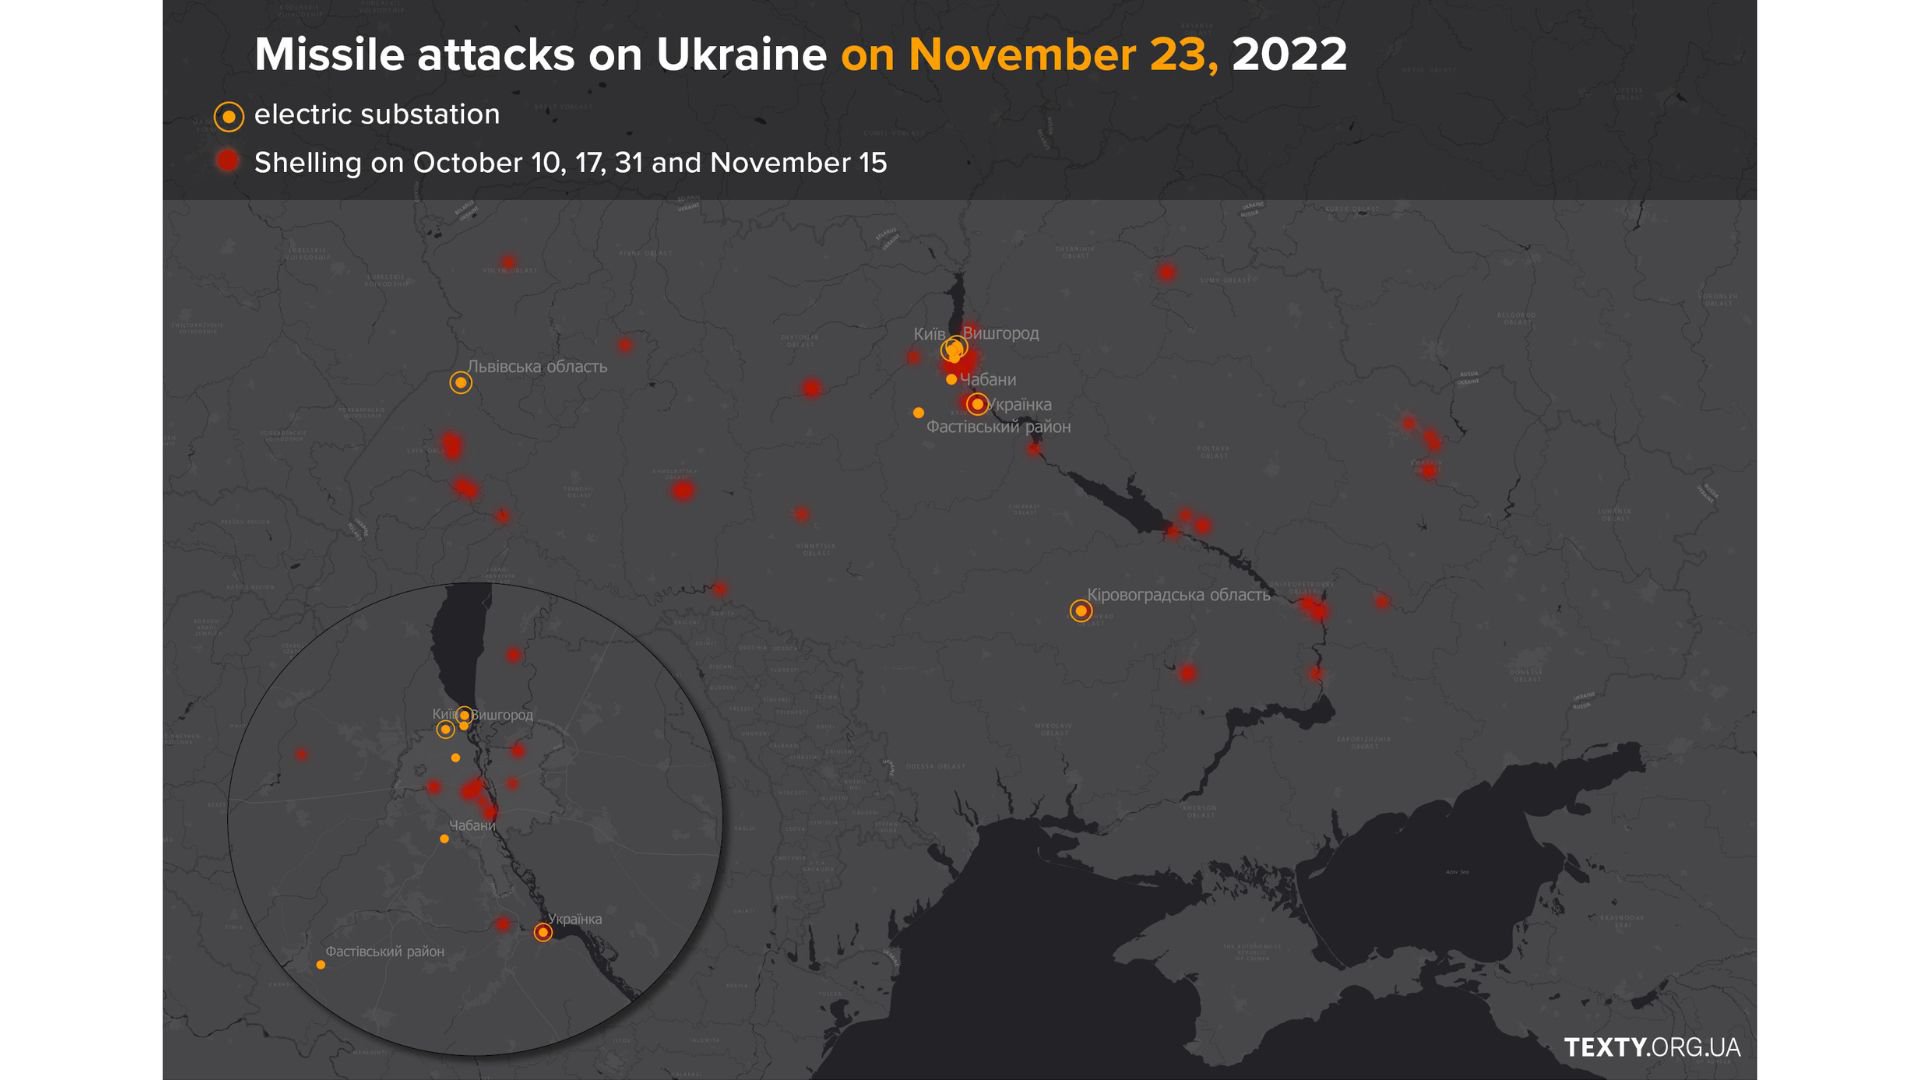
I love this photo because it’s a kind of sense loop - if you look closely on my laptop screen I'm working on the map of attacked electric substations. Here it is:
The line between working and personal time got extremely blurry. We work whenever we have an opportunity.
The number of negative factors which seriously affect our lives has increased while our ability to control them has decreased. This makes you feel helpless amid chaos. One of the aims of data viz is to bring at least some order to the chaos.
To do this, we look these factors at different angles to analyse and turn them into stories. We aren't trying to restore a sense of security, but rather try to restore the ability to navigate the situation.
Visualising the war
The projects created over the last year and almost a half tell about the impact of war on the physical level (we cover the situation in the front lines and the consequences of attacks).
And on the information level: we identify and analyse Russian disinformation and propaganda.
The information we use in our work isn't something abstract to us. Its character is defined by the context and since we are also part of that context, we are extremely sensitive to it.
They say that “One death is a tragedy. Many deaths are a statistic”. But not for us.
While working on our projects, we try to process data on both the general and the personal levels so as not just to record events, but also to preserve their meaning for Ukrainians.
The information we use in our work has obviously changed. People need to get updates as fast as possible and nonstop.
That caused increasing activity on social media — especially on Telegram where people can get and share information quickly. That is why data verification is taking longer than before: quantity grows, quality drops.
At the moment, we mostly rely on the following sources:
- Data collected manually
- Information from eyewitnesses. It is unique but requires additional verification.
- Satellite images
- Information collected by code
Data from eyewitnesses
Our “Wall of Fire” project is based on a message of a soldier who is sitting in a trench and describing his day in detail including what weapons the Russians were firing at them and at what time.
The intensity was impressive, so we decided to reconstruct just one minute in the Ukrainian trench.
We took the story to a military expert who checked it and provided details on each type of weapon. We combined these characteristics with information from the message and created scenarios for each type of artillery mentioned.
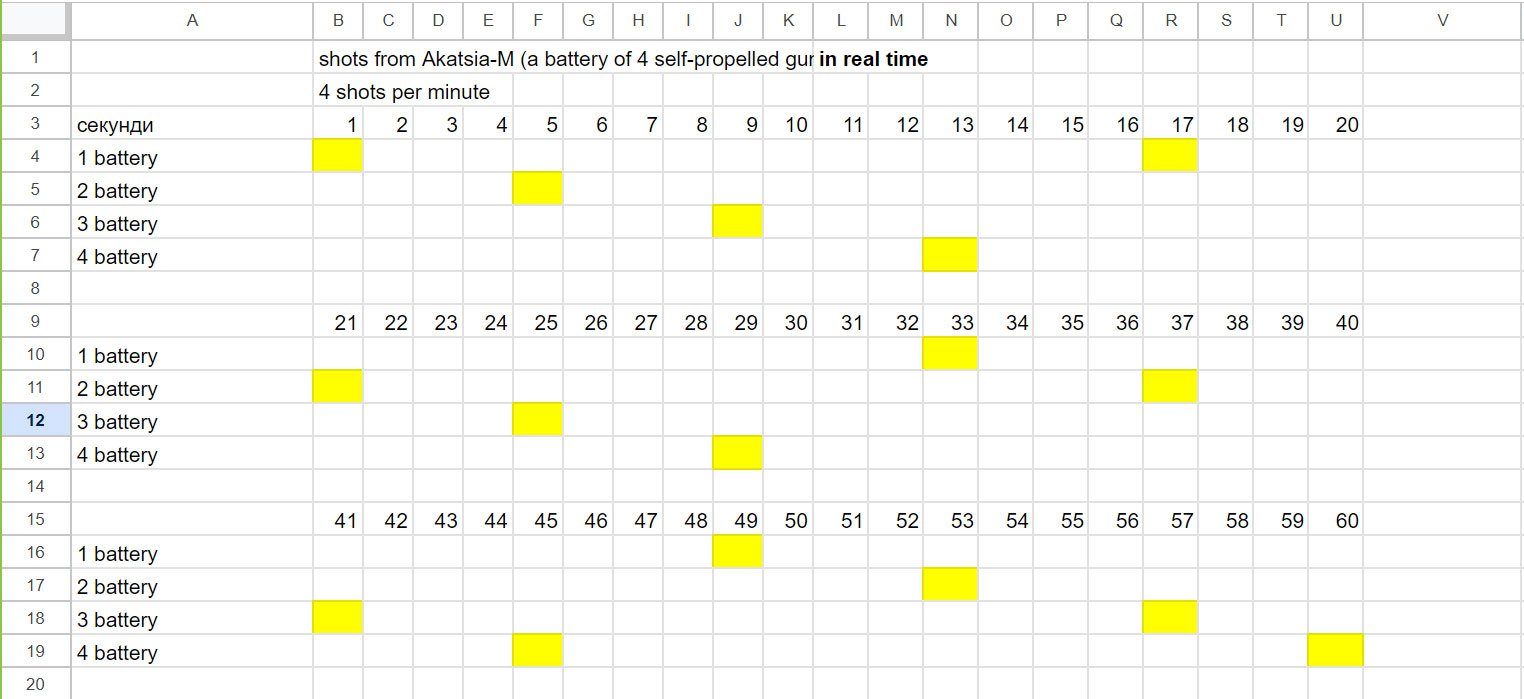
Also we found real sounds and forms of the defeated area and finally created an interactive model illustrating one minute in a Ukrainian trench.
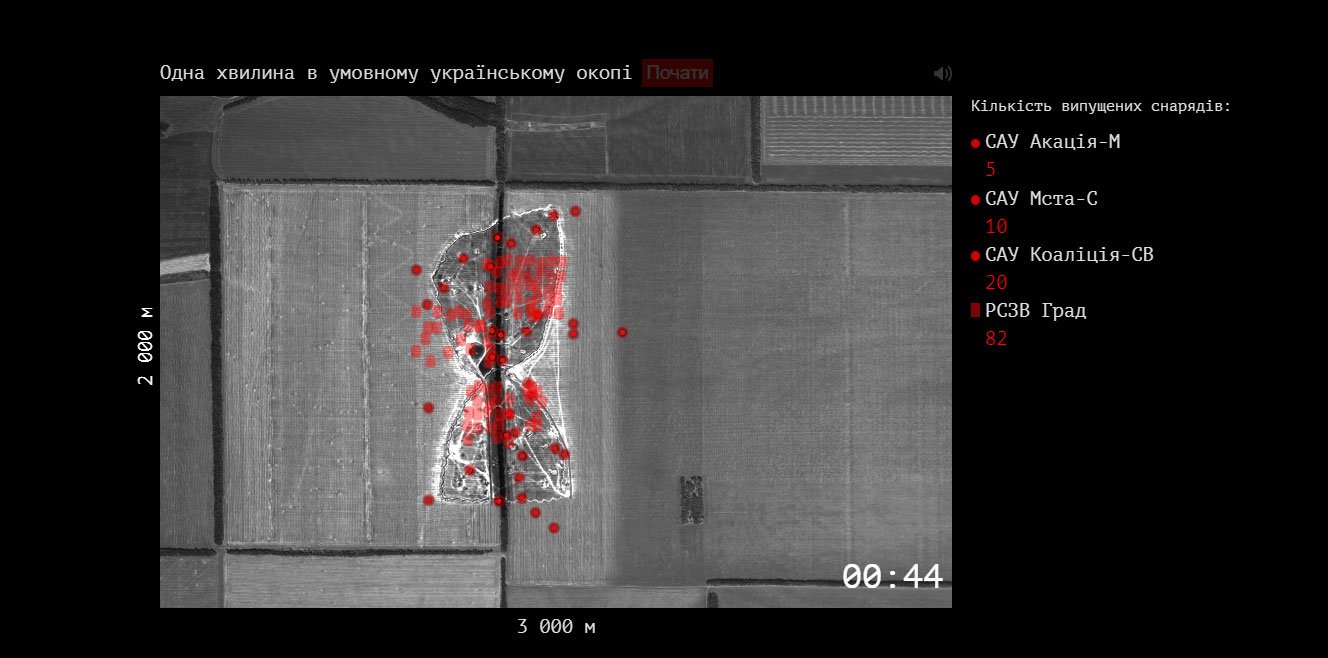
Not only does this material cover our lack of weapons, but it also helps to imagine the situation faced by the people in battlefields.
Here is an interesting fact: after the materials were published, another soldier from the front line contacted us and provided some important clarifications. His comment was added to the article.
Collecting data yourself
It’s a great way to make sure it is reliable.
On February 24, 2022, we ran a quick search for news about the first missile strike.
That information was transformed into a map, and that was the final goal.
However, the strikes continued on the next day and the day after that.
The small spreadsheet started to grow.
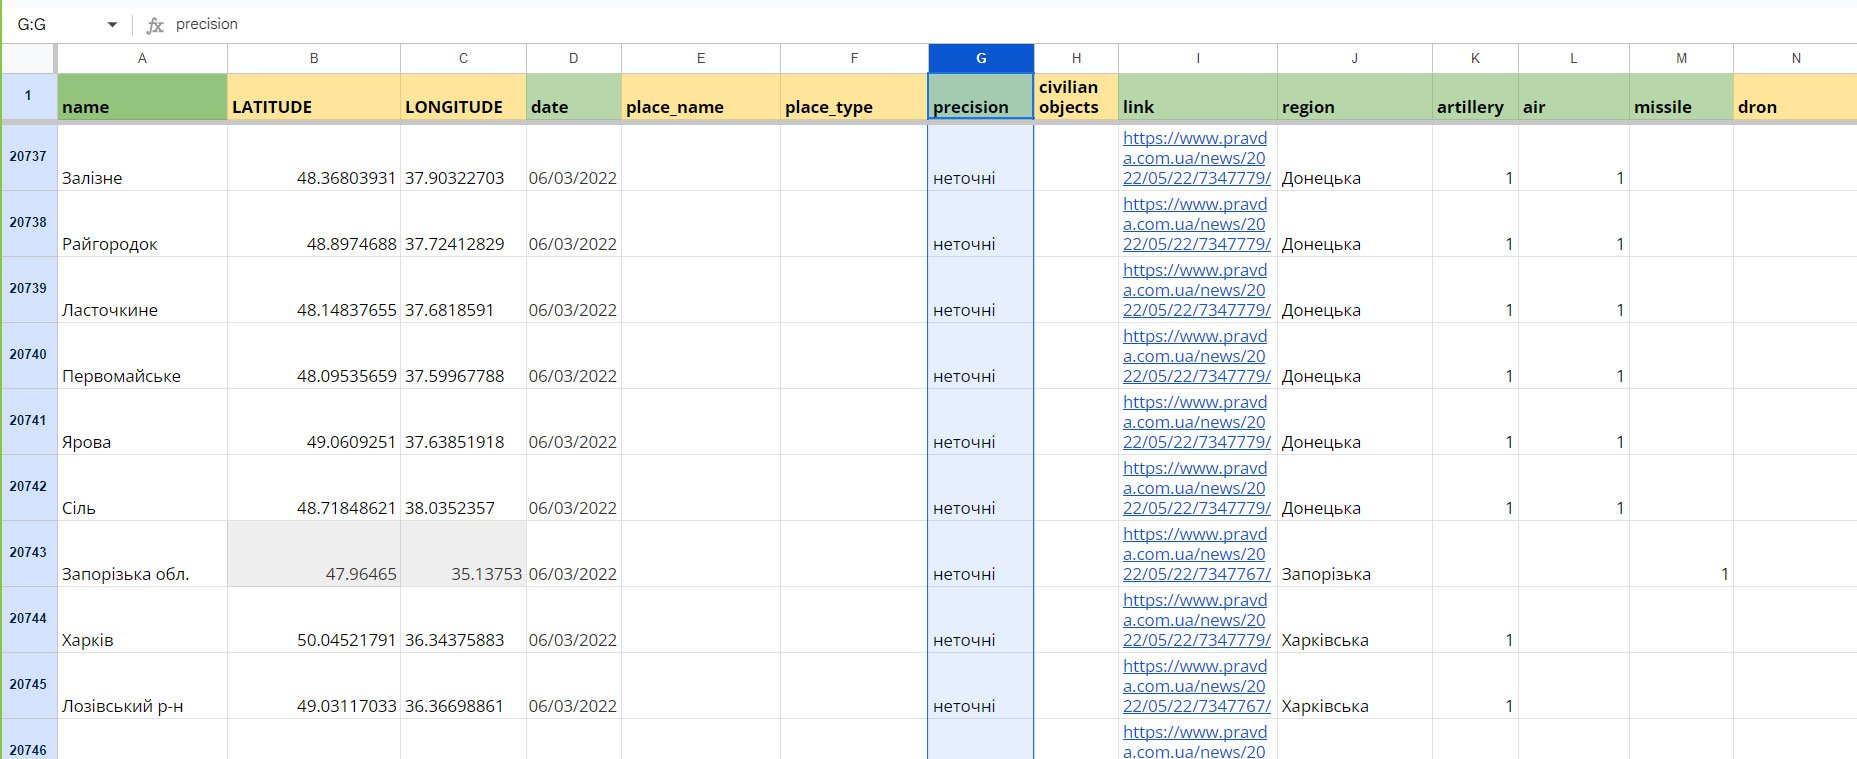
I added extra columns to record various types of strikes (missiles, artillery, air, and, beginning autumn 2022, drones).
Besides I have to identify the precision of coordinates since reports often mention only the name of a town or even of a region.
To solve that problem, I combined sources of information to piece the puzzle.
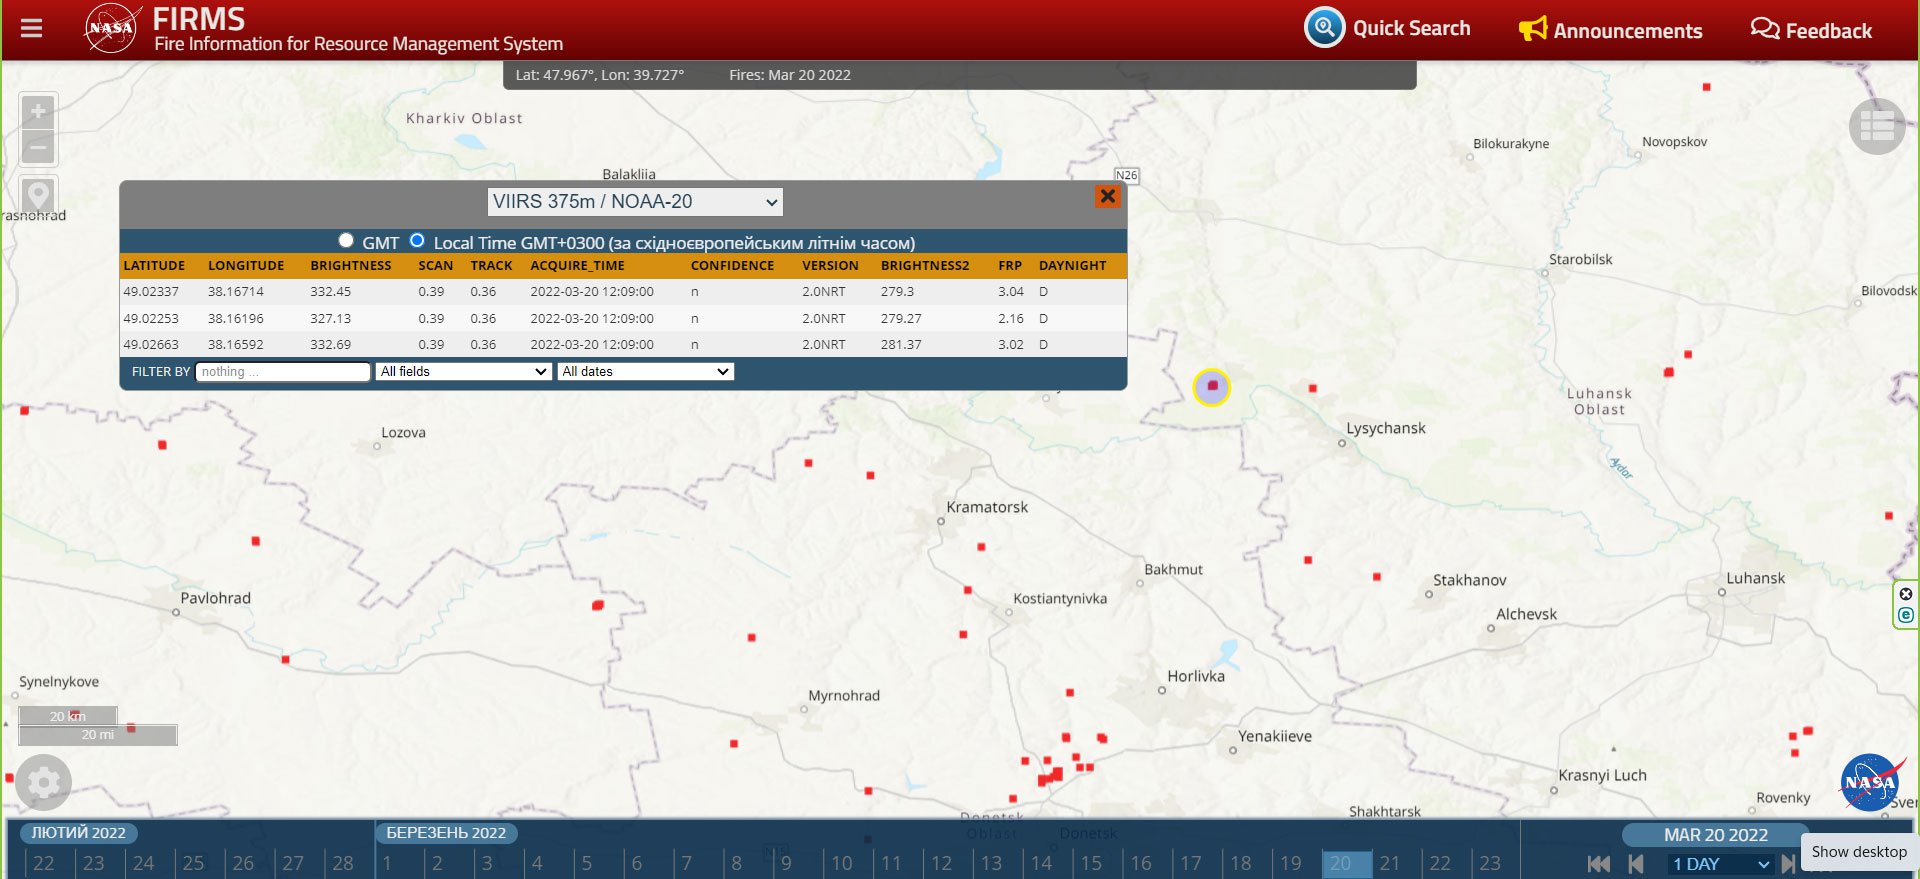
Whenever I lacked the exact address, I checked the locations on NASA’s FIRMS map which detects fires.
If a fire was registered on the day when the locality was struck by the enemy, I marked the fire as a hit. This method is not exactly straightforward: for example, you have to discard all the long-burning fires registered by satellites at certain large productions.
For half a year, I just collected this data manually every day. The process gave me a sense of stability. In the summer of 2022, Planet.com kindly provided us access to their database of high-resolution satellite imagery. So we decided to merge the data from the spreadsheet with the images of destroyed cities and create an interactive map.
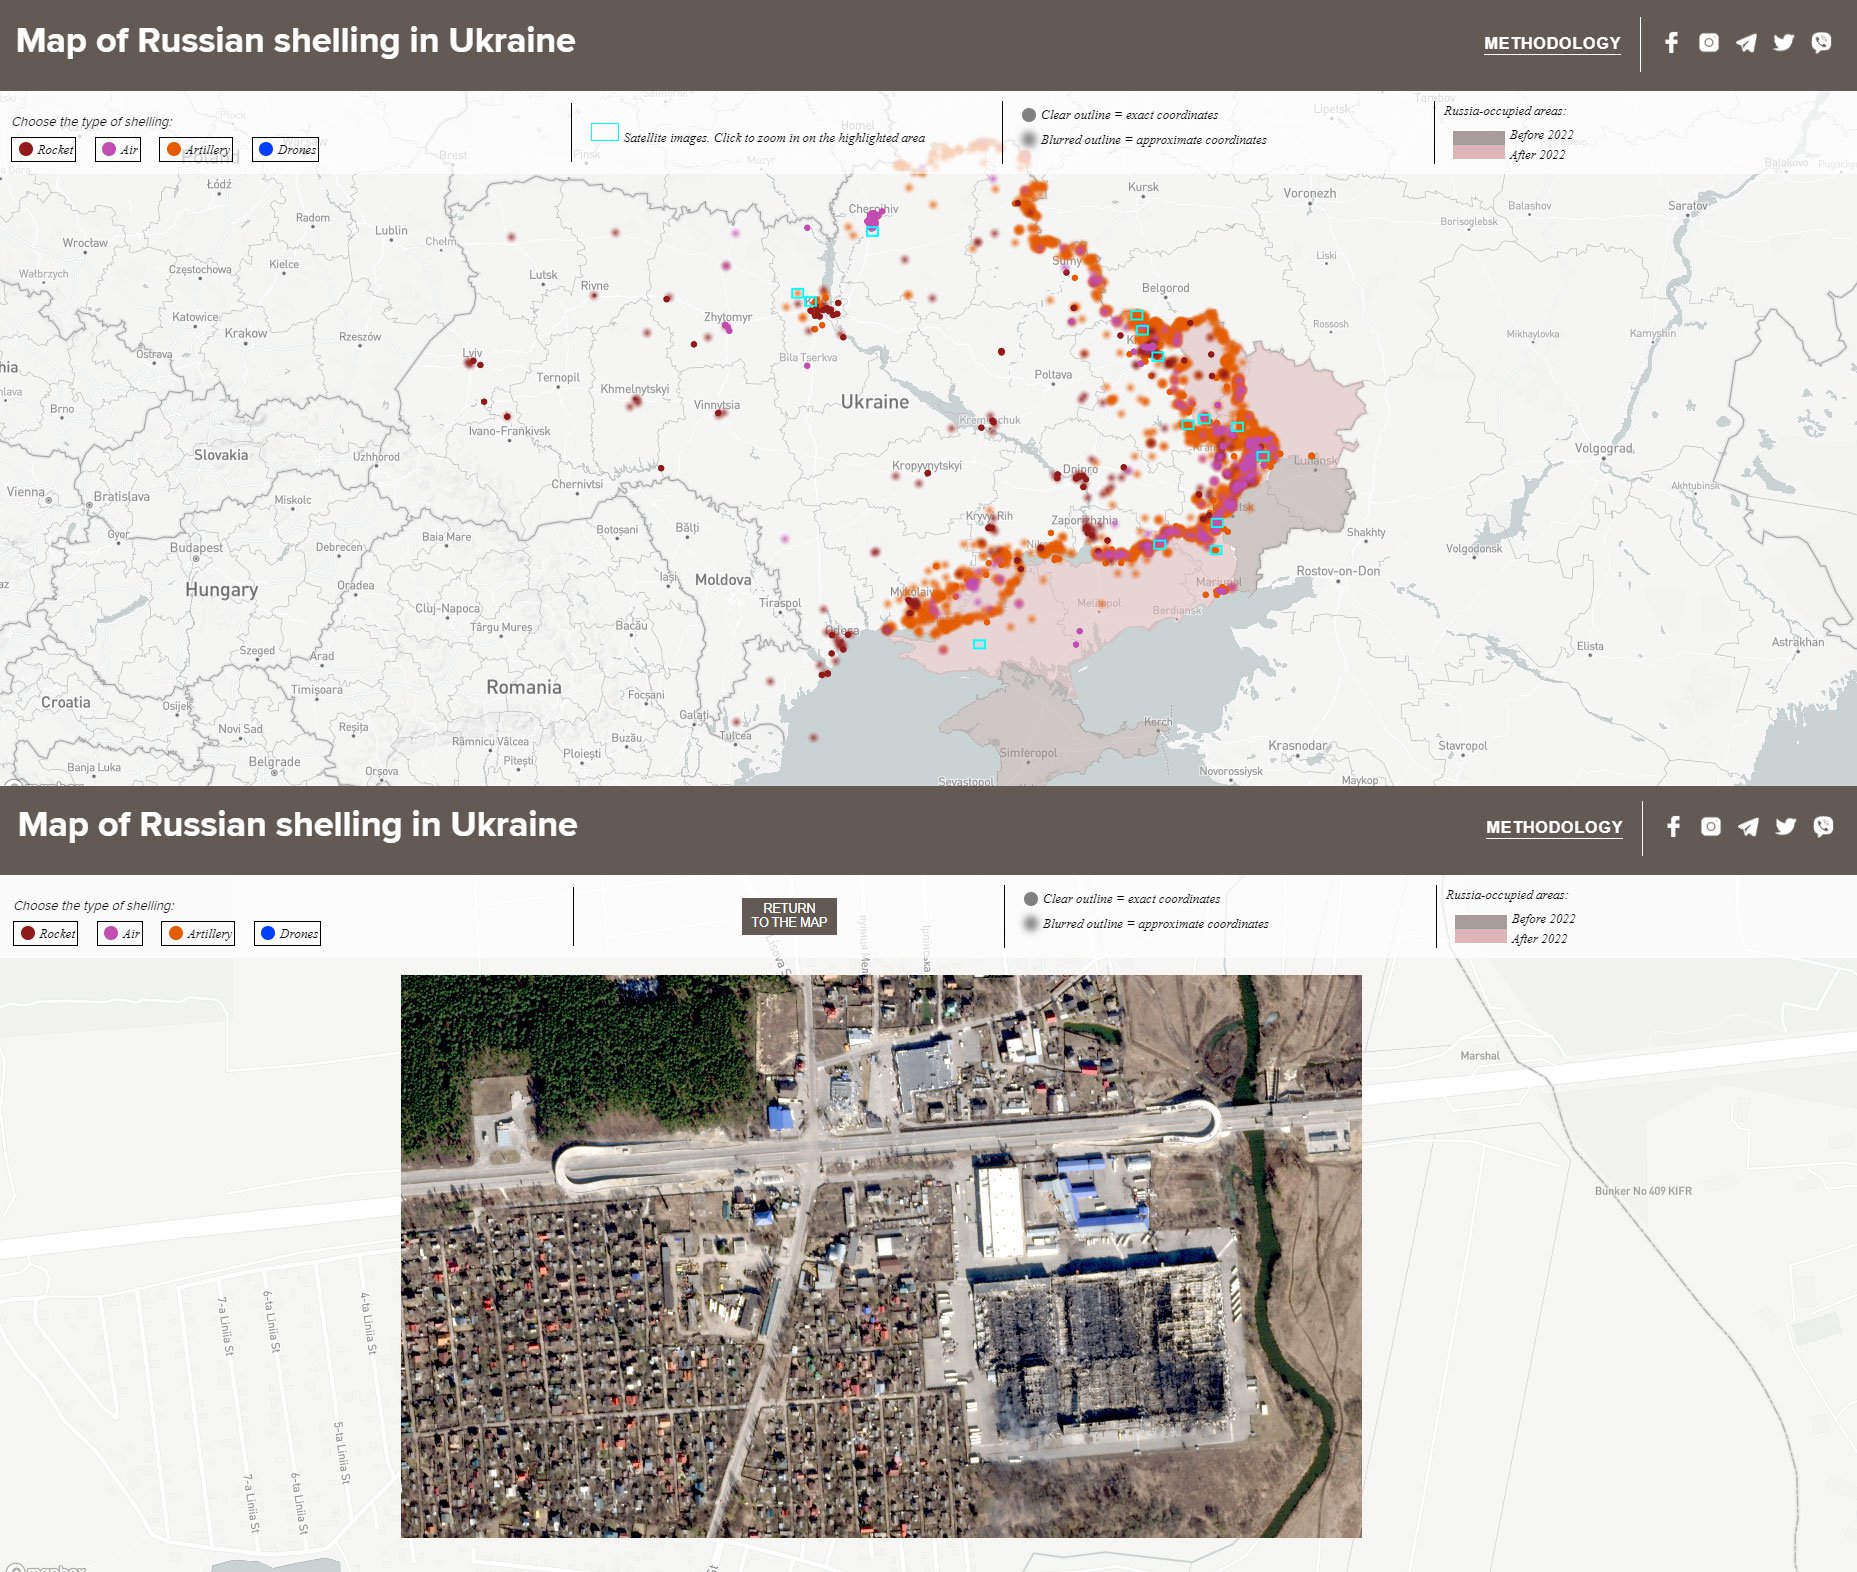
Sadly, the spreadsheet keeps growing, and the map is being updated regularly.
Satellite imagery
Satellite images are another reliable source of data.
We have used them in several projects — in particular, the investigation on stolen Ukrainian grain. Stolen grain was frequently mentioned in the media in spring 2022, so we collected various information on the subject and analysed it.
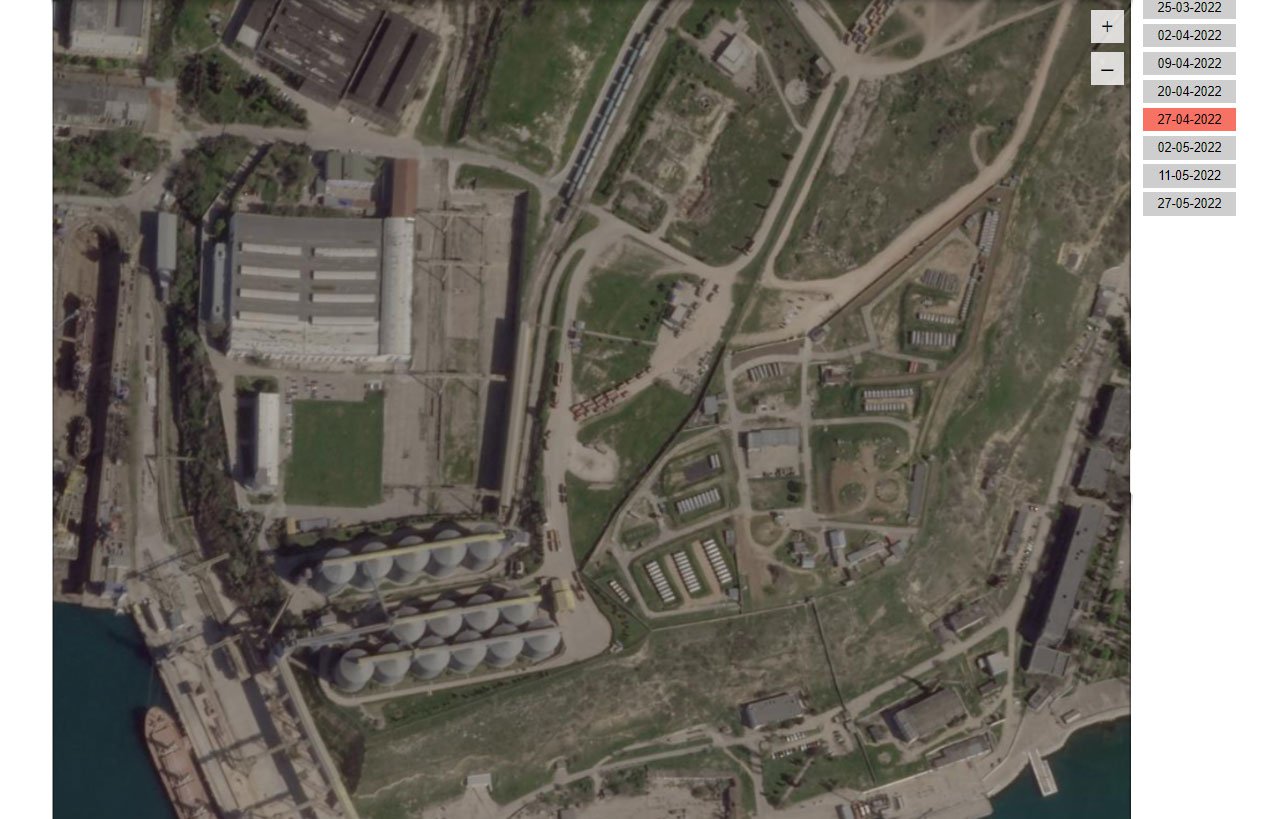
I’ll skip the first part, where we showed changes in the export structure and routes of Russian cargo ships and go straight to the second part, we looked at satellite images of the port of Sevastopol.
The pictures show an increase in grain shipments near the Avlita terminal. Last year's photos contained no evidence of freight trucks lining up near the port. However, in April 2022, the number of trucks increased dramatically, and loaded cargo vessels began to depart from the port at regular intervals.
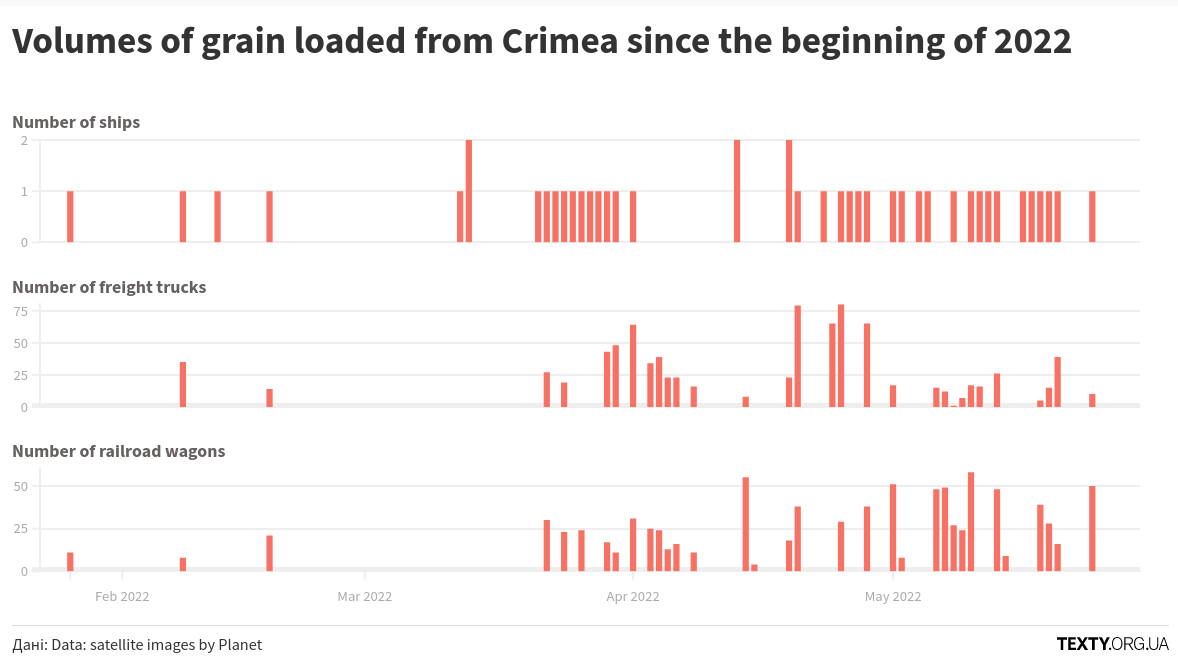
We used an algorithm to identify trucks, freight cars and vessels and count their numbers on the images for different dates.
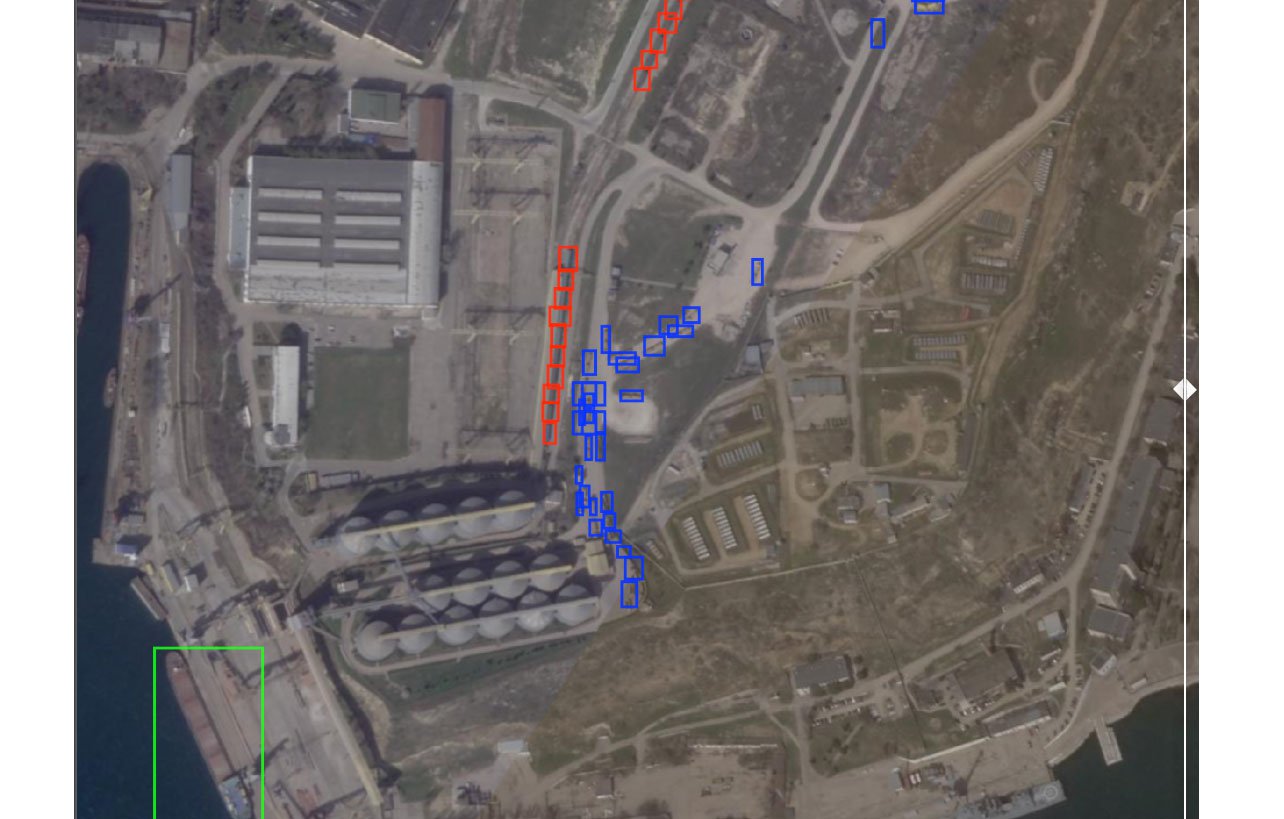
Knowing the carrying capacity of each type of transport in the images, we determined the approximate volume of grain exported by the occupiers during the period thus preventing them from doing the crime in secret as they had intended.
Data collected by code
Mostly we use a code to analyse the content of news using models and harvest data from social media.
A good example is the project where we looked into the phenomenon of occupation Telegram channels: where and when they appeared,
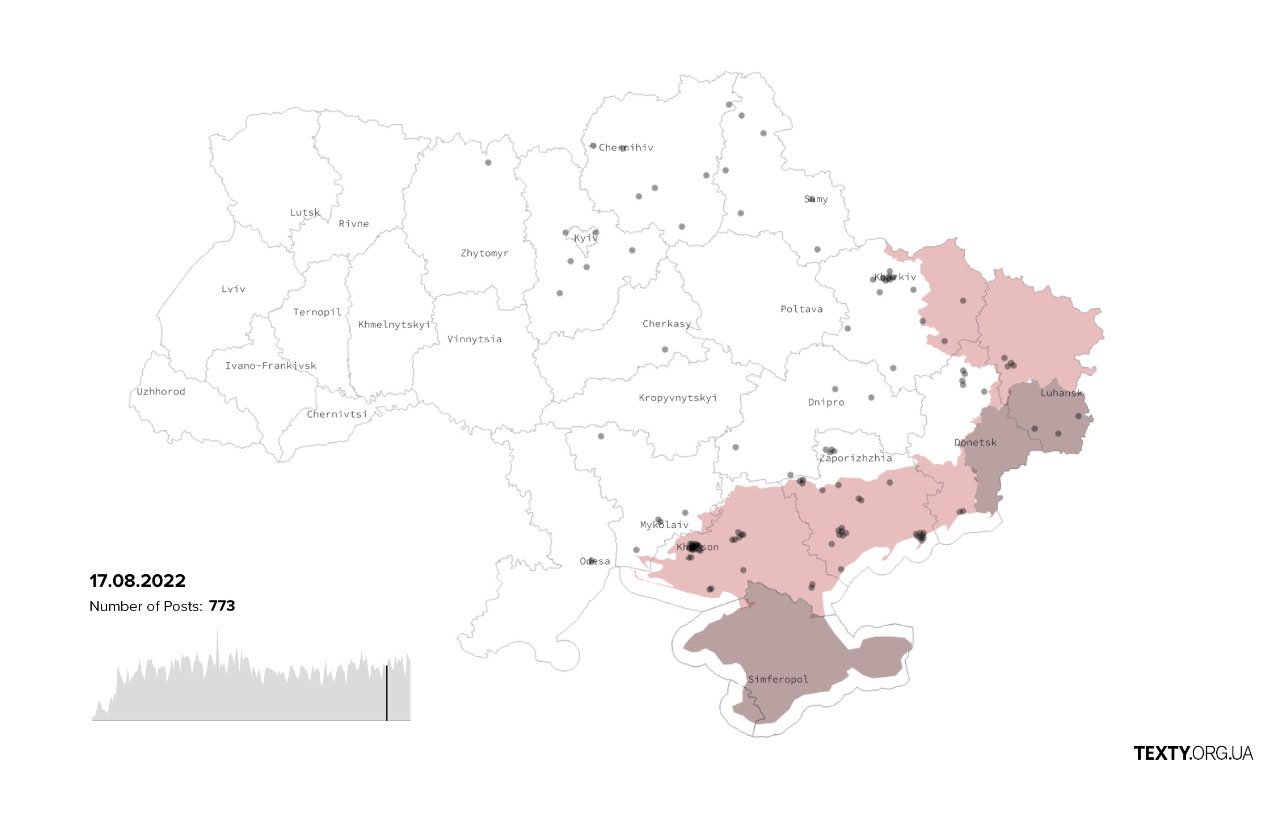
how long they existed,

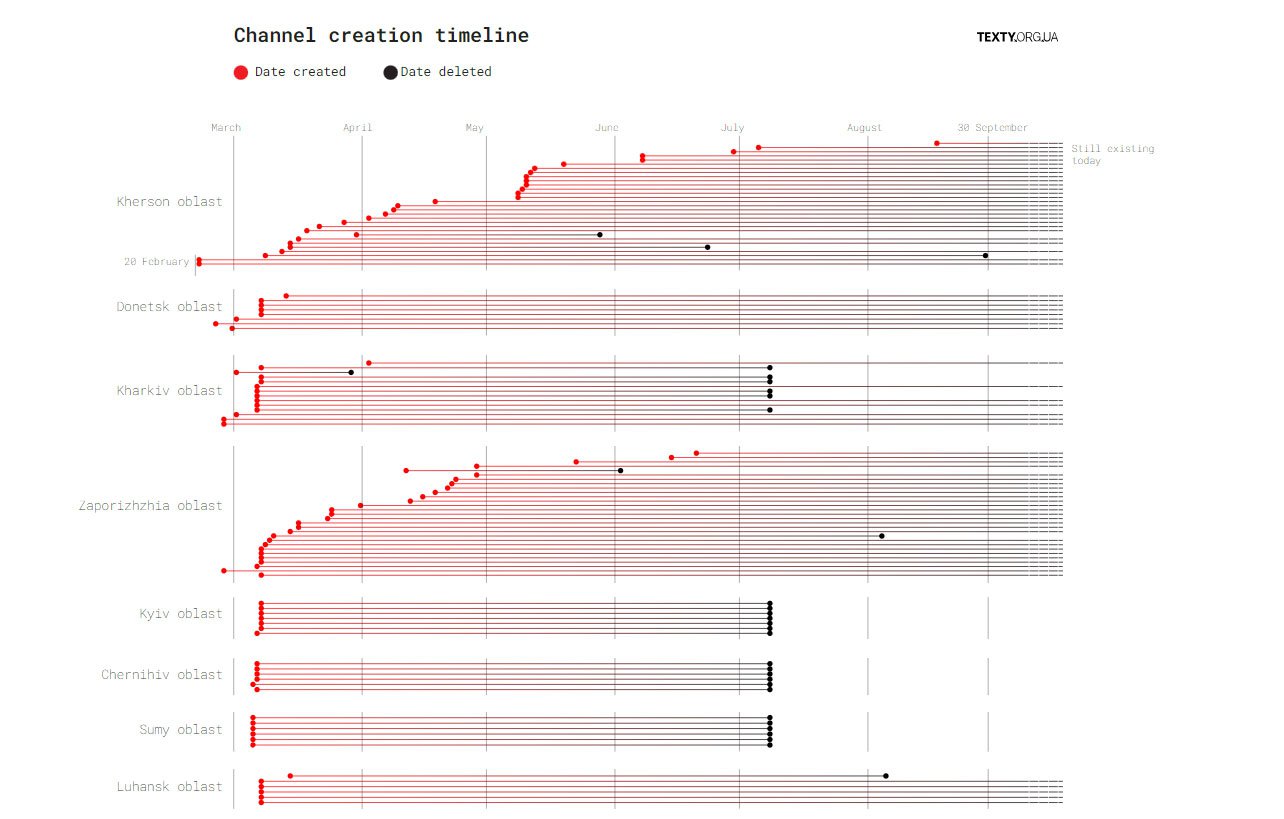
what they published and how they were interconnected.
This project is available in the English version on our website as well as all I have mentioned before. So welcome to texty.org.ua
To sum it up, our tools and methods mainly have remained the same.
It is the topics we cover, the nature of the information and our working conditions that have changed the most.
We are seeing each other face-to-face more and more often. The team are gradually coming back to Kyiv, but not because the threat has passed, but rather because we have got used to it.
However, getting used is a dangerous thing: for us not to lose vigilance,
for the rest of the world not to let the aggressor win and take the war elsewhere.
We really appreciate your support as we really need it.
I hope that soon I will be able to share my experience of working in the country that won the war.
Підпишіться, щоб отримувати найкращі статті на e-mail (раз на два тижні)
Підписатися