We have been regularly publishing a graph showing enemy losses and advances for the past several years. After one of our publications, we received a lot of criticism — and even more hate. So we want to explain why we chose this particular type of graph.
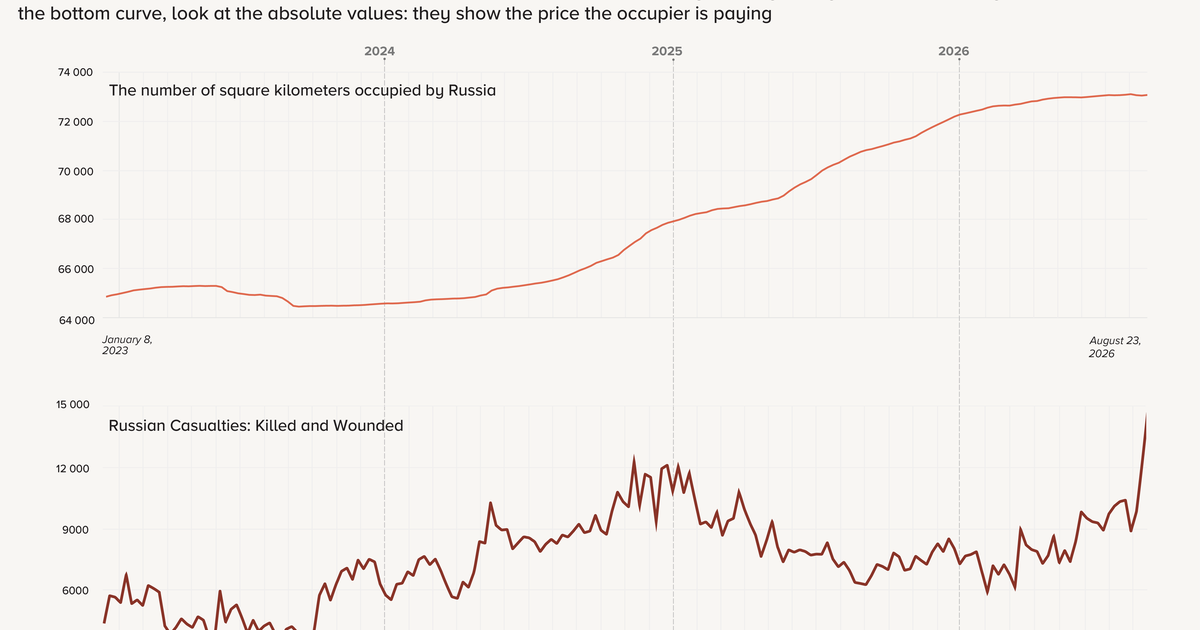
We have been criticized for comparing two graphs that use different types of data: the upper one shows cumulative figures, while the lower one shows weekly data. We believe this comparison is valid if we are not looking at the absolute numbers on the upper curve, but at the SLOPE of the line.
In other words, we look at the rate at which territory is being captured — the slope of the upper curve — and compare it with losses per week. The lower curve shows a rate, that is, the amount of something over a given period of time. In our case, it is the number of Russian casualties per week.
Why don’t we show the rate on the upper graph as well? Such figures can fluctuate considerably. If we showed only these fluctuations on both curves, they would become difficult to compare: the eye gets caught up in random spikes, making it harder to see the overall trend.
Instead, our approach is:
- at the top, we look at how quickly the territorial situation is changing, based on the slope of the line over a given period of time;
- at the bottom, we look at what this is costing the enemy — Russian casualties per week.
This combination makes it possible to quickly see what matters, without getting lost in minor fluctuations.
There is another very important point: you can immediately see the different phases of the fighting across the whole war.
This form of the graph lets you draw quick conclusions:
- October 2023 – August 2024: significant Russian losses, limited territorial losses — the situation is okay.
- October 2024 – January 2025: very heavy Russian losses, but also faster territorial losses — the situation is difficult, but under control.
- After that, enemy losses decline, while from May to August 2025, territory was lost quickly — the situation is bad.
- September – October 2025: Russian losses increase, and their advances slow down, suggesting stabilization.
- November 2025 – January 2026: the situation deteriorates significantly again.
- February 2026: the situation levels out.
- March – May 2026: the situation shows a trend toward improvement.
- June – September 2026: a trend toward Ukrainian victory, as the enemy has stalled and its losses are increasing.
We considered various graph formats, including one with cumulative Russian losses on one curve and cumulative territory lost on the other. That graph illustrates the trend less effectively because it requires comparing two slopes rather than one. Another option was to show smoothed rates of territorial loss versus enemy personnel losses on the upper and lower graphs. However, we ultimately settled on the version you see here.