(Un)veiled threat. Russian military bases. Satellite monitoring
We have made a visualization that allows you to monitor Russian military equipment around Ukraine and in the occupied territories. It will be constantly updated as new images appear.
In March 2021, Russia began a significant increase in its forces on the borders of Ukraine and in the occupied Crimea and parts of Donetsk and Luhansk regions.
After US involvement and Biden's talks with Putin, the Kremlin withdrew some of its personnel and equipment from the borders, but not all of it. In the autumn of 2021, the second phase of escalation began, and according to various estimates, at the end of December 2021 there were at least 120,000 troops, heavy equipment, artillery and missile systems, air defense and logistical support of troops in the immediate vicinity of Ukraine's borders or in the occupied territory of Ukraine.
On the interactive map (with the help of points and polygons) we showed all the locations of the military equipment known to us from open sources, where changes have taken place recently. But the most interesting thing is at the bottom of the map: we use Sentinel-1 satellite data to estimate how much equipment there is on a particular military base.
Settlement: Yelnya / Coordinates: 54.60600330049135, 33.157733220304166
By zooming in on the map, you can see areas where a permanent or temporary military base is located. After clicking on the spot, you will see images created by us based on Sentinel-1 data, which can be used to monitor the presence of military equipment. The date next to each military base shows the time of the most recent image. Click on the image and you will go to the interactive version of this image, if it is featured on the site that uses Sentinel data.
The satellite images used are made by a radar sensor and so do not depend on the weather and time of day. Sentinel-1 satellites survey the terrain at least once every six days (this is roughly true for Europe, read more in the methodology). At the same time, due to the relatively low resolution (up to about 10x10 meters per 1 pixel), individual units of equipment are almost impossible to see, but its accumulation is seen as a set of brighter dots (purple, green, or white). For example, consider the base in Yelnya (Smolensk region), for which there are detailed satellite photos for November 2021, and compare them with the images in our visualization:
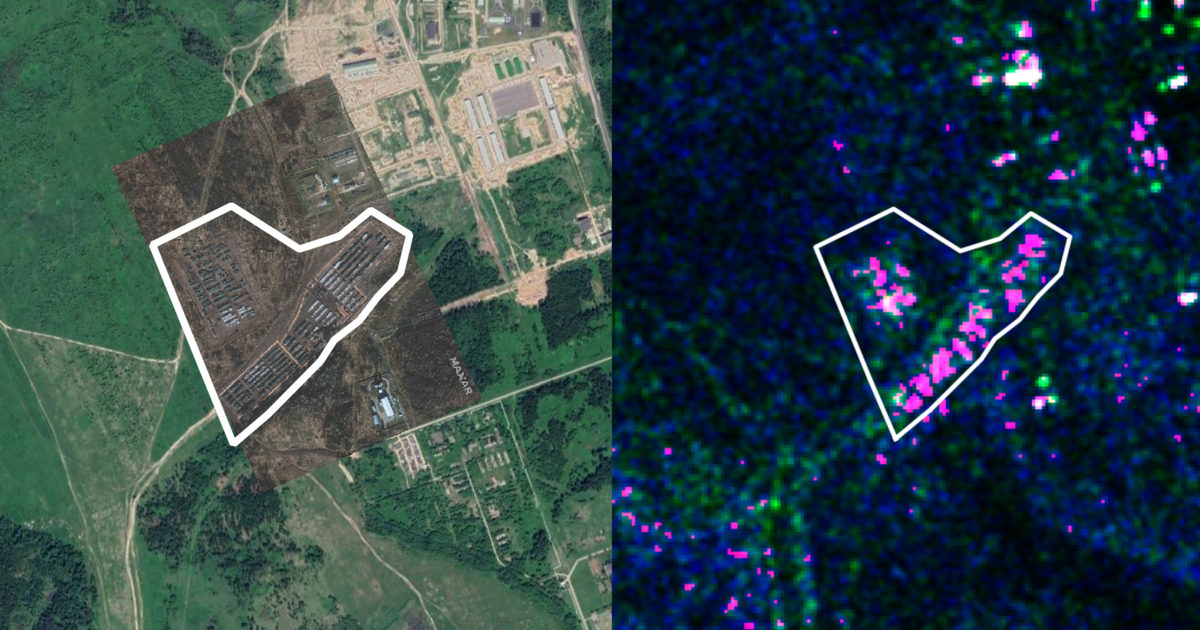
The satellite image from MAXAR (brown, rotated, in the center of the image) shows lined up rows of armored units and large military vehicles. The white line shows the boundaries of the site filled with equipment. You can also see this picture in detail at this link. On the right, on the Sentinel-1 radar, all this equipment inside the white outline looks like a cluster of color pixels, brighter than the background. So, when viewing our interactive map, you need to pay attention to the accumulation of similar pixels of purple, rarely green or even less frequently white inside the white outlines of the bases.
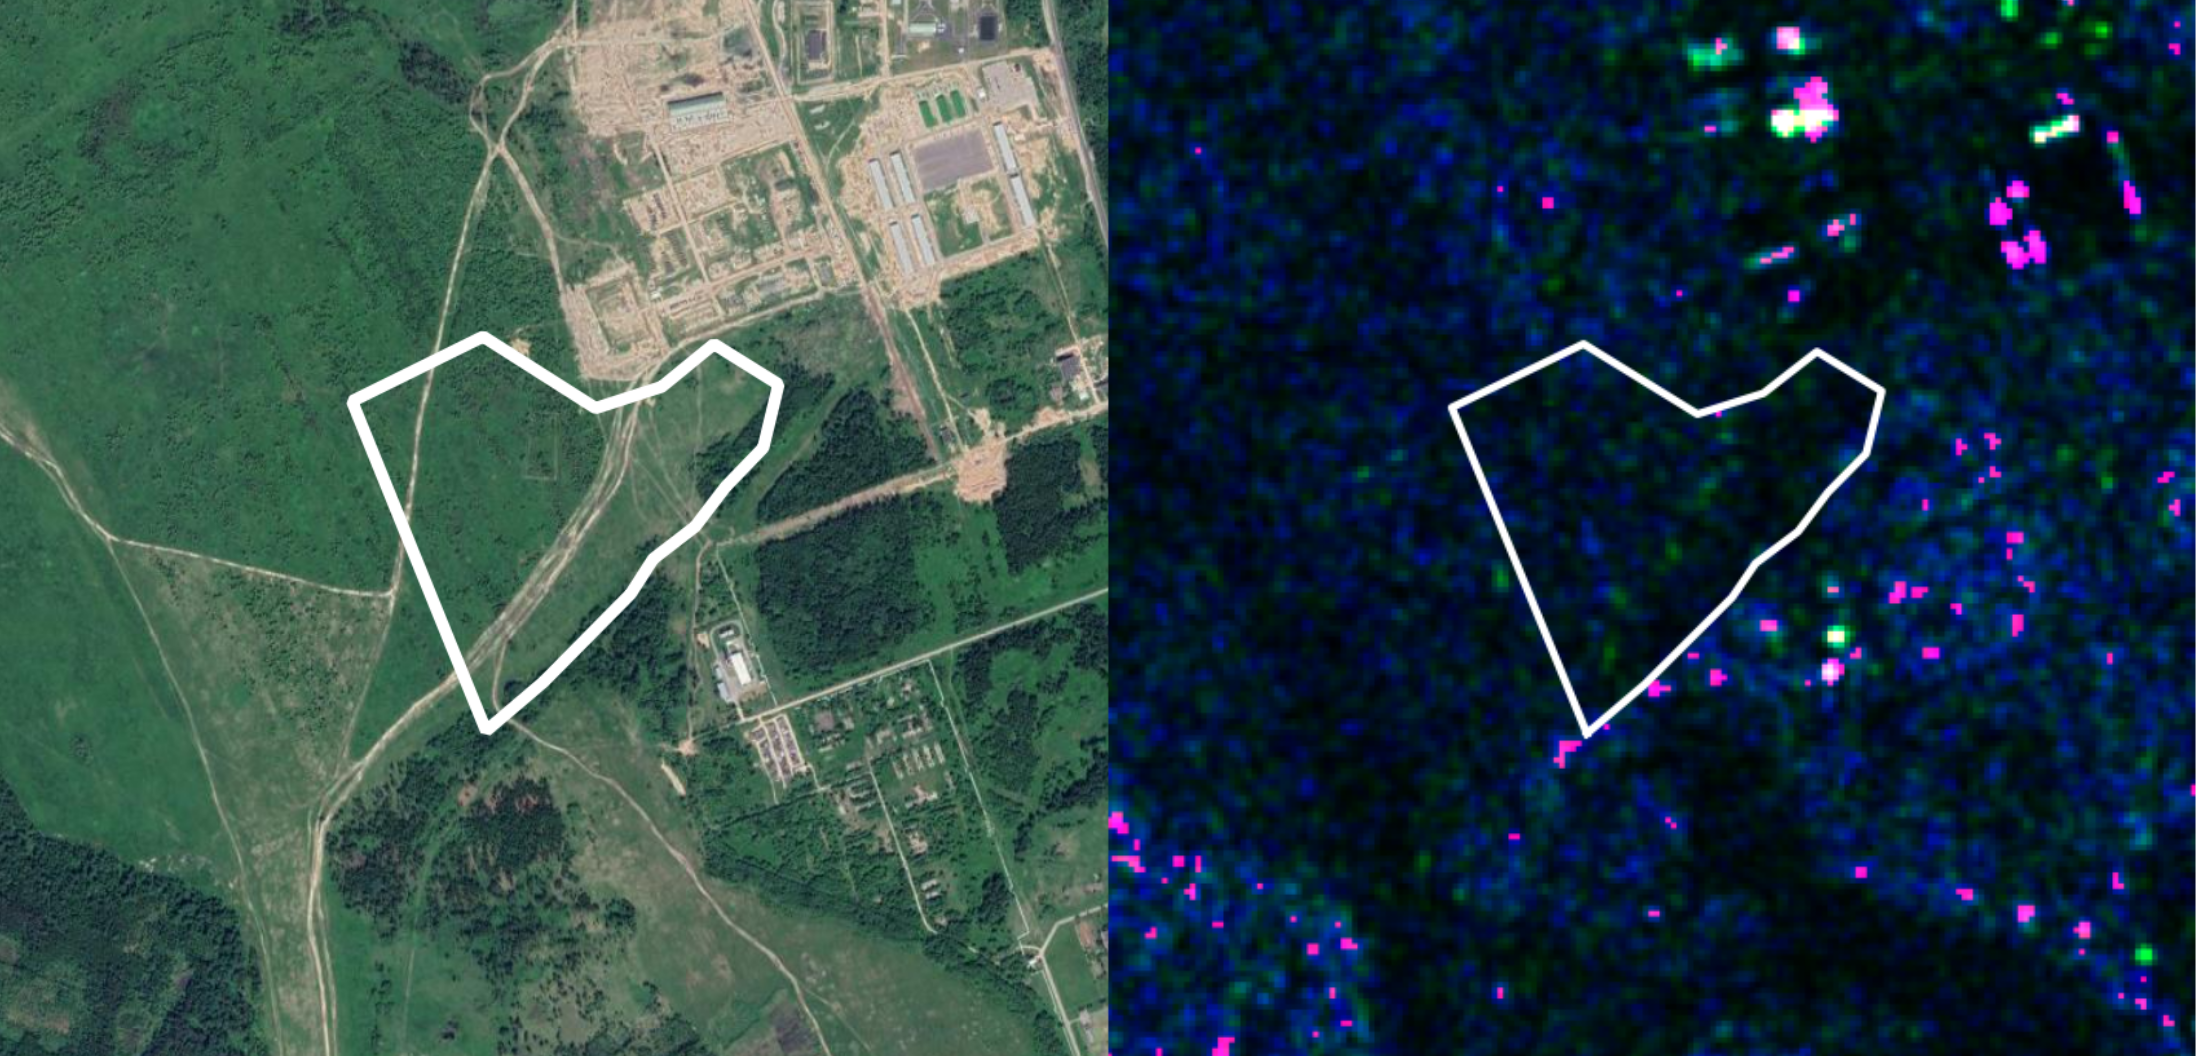
For comparison, here is another picture from Sentinel-1, but taken more than a year ago. You can see that the machinery (accumulation of bright pixels in the white outline) is not there.
We are grateful to OSINT experts The_Lookout_N, Mike Eckel, C O U P S U R E, Michael J. Sheldon, Konrad Muzyka for their examples of satellite imagery analysis. We used some of their research to create this project.
The satellite images which you see in this visualization are not actual photos but rather composite images that we create with the help of our computer program based on data from Sentinel-1.
Each image under the map is based on data obtained by satellites during their passage of the same orbit. The thing is, the radar image depends on the angle of the signal from it to the Earth's surface, and it is different for different orbits (to cover the entire Earth, satellites need several dozen revolutions, which they make in different orbits). Therefore, it is more correct to compare not all radar data, but only those retrieved from the same orbits, which we do. We take the freshest image for a specific place and find all the previous ones made from the same orbit. These are the pictures you see under the map.
Sentinel-1 satellites capture the terrain at least once every six days, to put it bluntly. However, the reality is much more complicated: there are two satellites, Sentinel-1A and Sentinel-1B. The full period of each is 12 days. That is, once every 12 days, the same satellite flies over the same area on the Earth's surface. However, due to the fact that there are two of them, it is possible to take pictures of some point on the surface from the same orbit every six days, but this is only in theory. In practice, such a 6-day period is only guaranteed for Europe. For example, a year ago Sentinel-1 monitored almost the entire surface of Russia. Now, for reasons unknown to us, a much smaller area of this country remains under the supervision of this satellite. For some of its regions, the renewal period is 12 days, and only in fragments of the European part of Russia the renewal time can be 6 days.
Due to the fact that the surface of the planet can be seen from several neighboring orbits, updates for an area may appear more than once every six days, but these will be images with different radar characteristics, thus, they are more difficult to compare with each other.
We use the Python programming language and Google Earth Engine to search and process new satellite images from Sentinel-1 on a daily basis.
Interestingly, the data from Sentinel-1 allow one to monitor many natural and man-made phenomena ranging from floods to the search for air defense radars or monitoring maritime traffic.


