Who voted for Zelenskiy after all? Most of Tymoshenko voters supported him in the 2nd round of elections.
We have no intention to draw psychological portraits or label people. What we offer is our own explanation, which is based on concrete data from election precincts.
By: Anatoly Bondarenko
In order to simulate the distribution of the votes of all the first round voters between Volodymyr Zelenskiy and Petro Poroshenko in the second round of elections we'll use data on the number of votes at each precinct.
What we have to do is to make a balance equation for each of the precincts that could be explained by Zelenskiy’s example: the results of each of 39 candidates, received in the first round, are multiplied by coefficient of migration of the votes in the second round (unknown variable) and then their sum is calculated. This sum should be equal to the result of Zelenskiy at the same precinct in the second round of elections. We assume that these coefficients are the fractions of all the votes received by Boyko, Lyashko, Tymoshenko and by others whose voters came and voted for Zelenskiy in the second round. Similarly we can make exactly the same equation, although using other coefficients, for Poroshenko’s votes.
Similar equations, as we have noted, could be made for each precinct; and by solving them we can figure out two sets of coefficients for Poroshenko and Zelenskiy. These coefficients will differ, because the share of the supporters of, let’s say, Tymoshenko, ready to vote for Poroshenko or Zelenskiy in the second round, also differ. We call such coefficients “the coefficients of migration (or transition) of votes” and they will help us to figure out who voted for Zelenskiy (and Poroshenko) in the second round.
Similar problems could be solved, among others, by a method called linear regression.
In our case the coefficients we are looking for should have some additional limitations; in order to be meaningful coefficients of migration of votes their meanings should be within the interval from 0 to 1. “0” means none of the first round voters of particular candidate (for example Lyashko) voted for Zelenskiy in the second round, “0.5” means the half of that candidate’s supporters voted for Zelenskiy, and “1” means all of them voted that way.
However, it is even better to apply an approach called "Bayesian linear regression". In this case we are able not only to add the coefficients limitations needed, but also to evaluate the results in the terms of possible mistakes. Similar approach was used by us in our model of aggregated election ratings of the candidates before the first round of elections – http:/
So this method allows us to figure out the coefficients of “the votes migration” not as a separate number, but as a whole interval of numbers (on the X-axis) with a corresponding probability for each of them (Y-axis values) modeled on the basis of data from first and second rounds. The higher the probability is – the surer can we be that the coefficient is right. Such functions are called “probability density functions” .
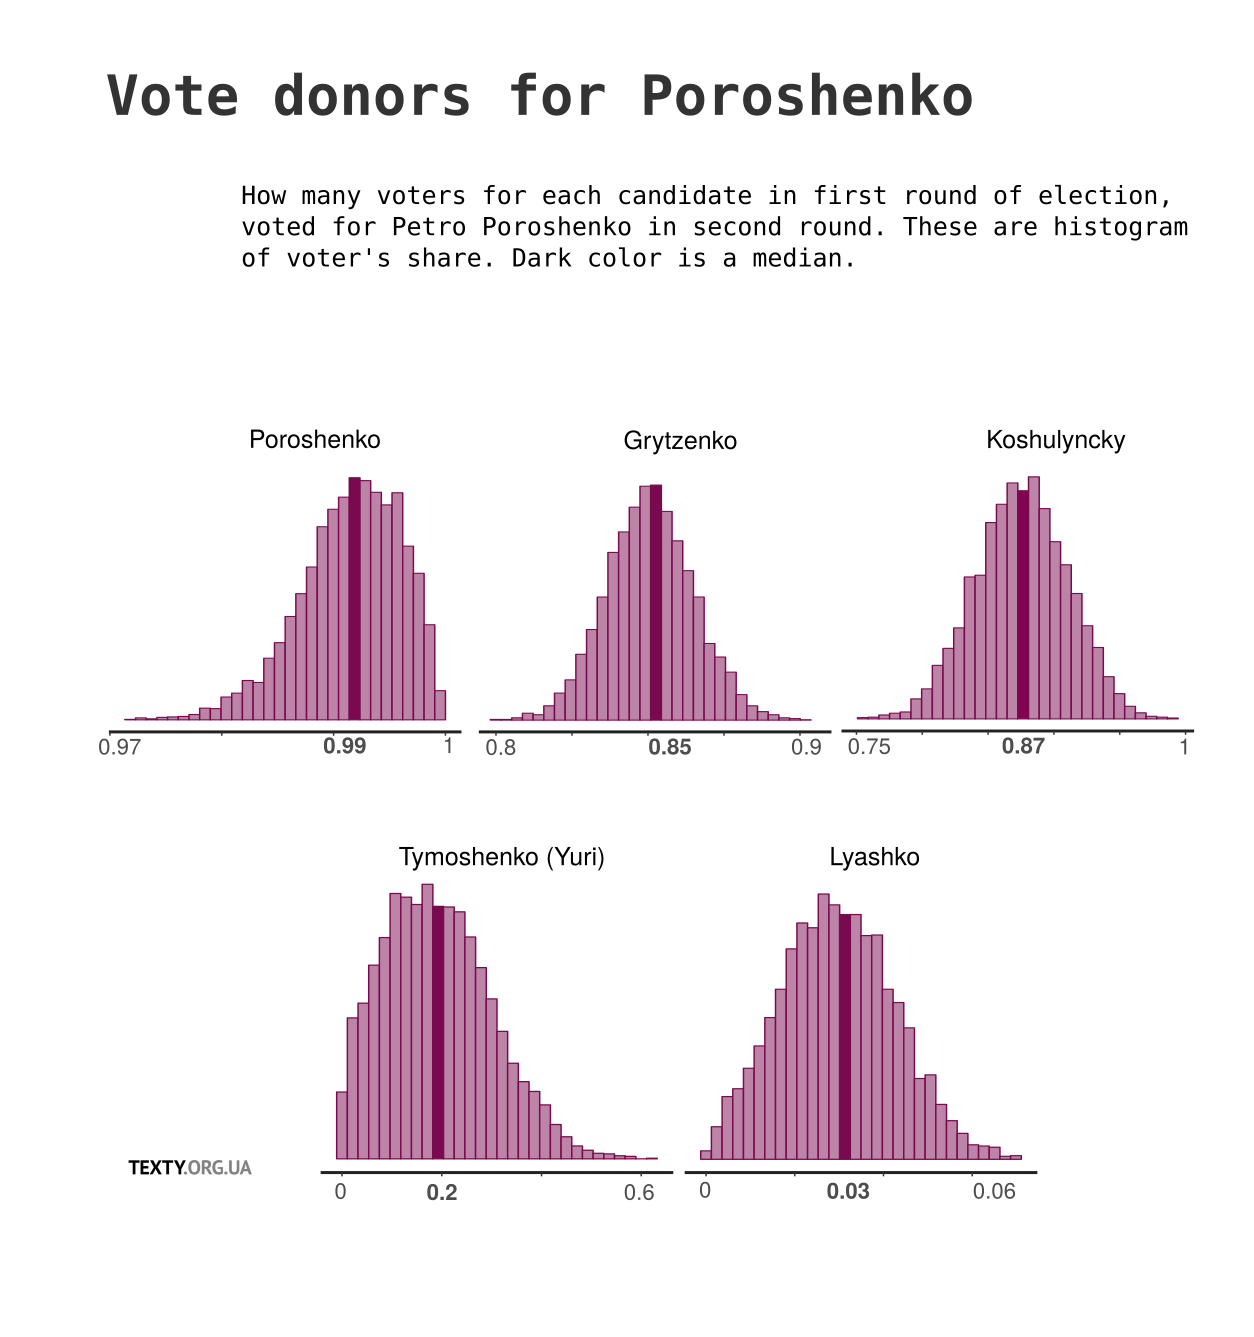
Please click the graph to see high quality picture
We can see that a significant part of voters of Grytsenko and Koshulynskyy supported Poroshenko in the second round of elections (0.85 or 85% and 87% respectively). It looks as those are the people whose major value is Ukrainian Independence that prevails among other things. Also 20% of Yuriy Tymoshenko voters supported President Poroshenko, and the voters of Oleg Lyashko added 3% to Poroshenko’s votes in the second round. This actually is all about the significant migrations of votes that Poroshenko’s got.
| First round candidate | How many voices migrated in the second round |
| Petro Poroshenko | ~3 million |
| Anatoliy Hrytsenko | ~1.1 million |
| Ruslan Koshulynskyy | ~270,000 |
| Oleg Lyashko | ~30,000 |
| Yuriy Tymoshenko | ~20,000 |
Tabel 1, model of "migration of votes" from other candidates to Poroshenko in the second round of elections
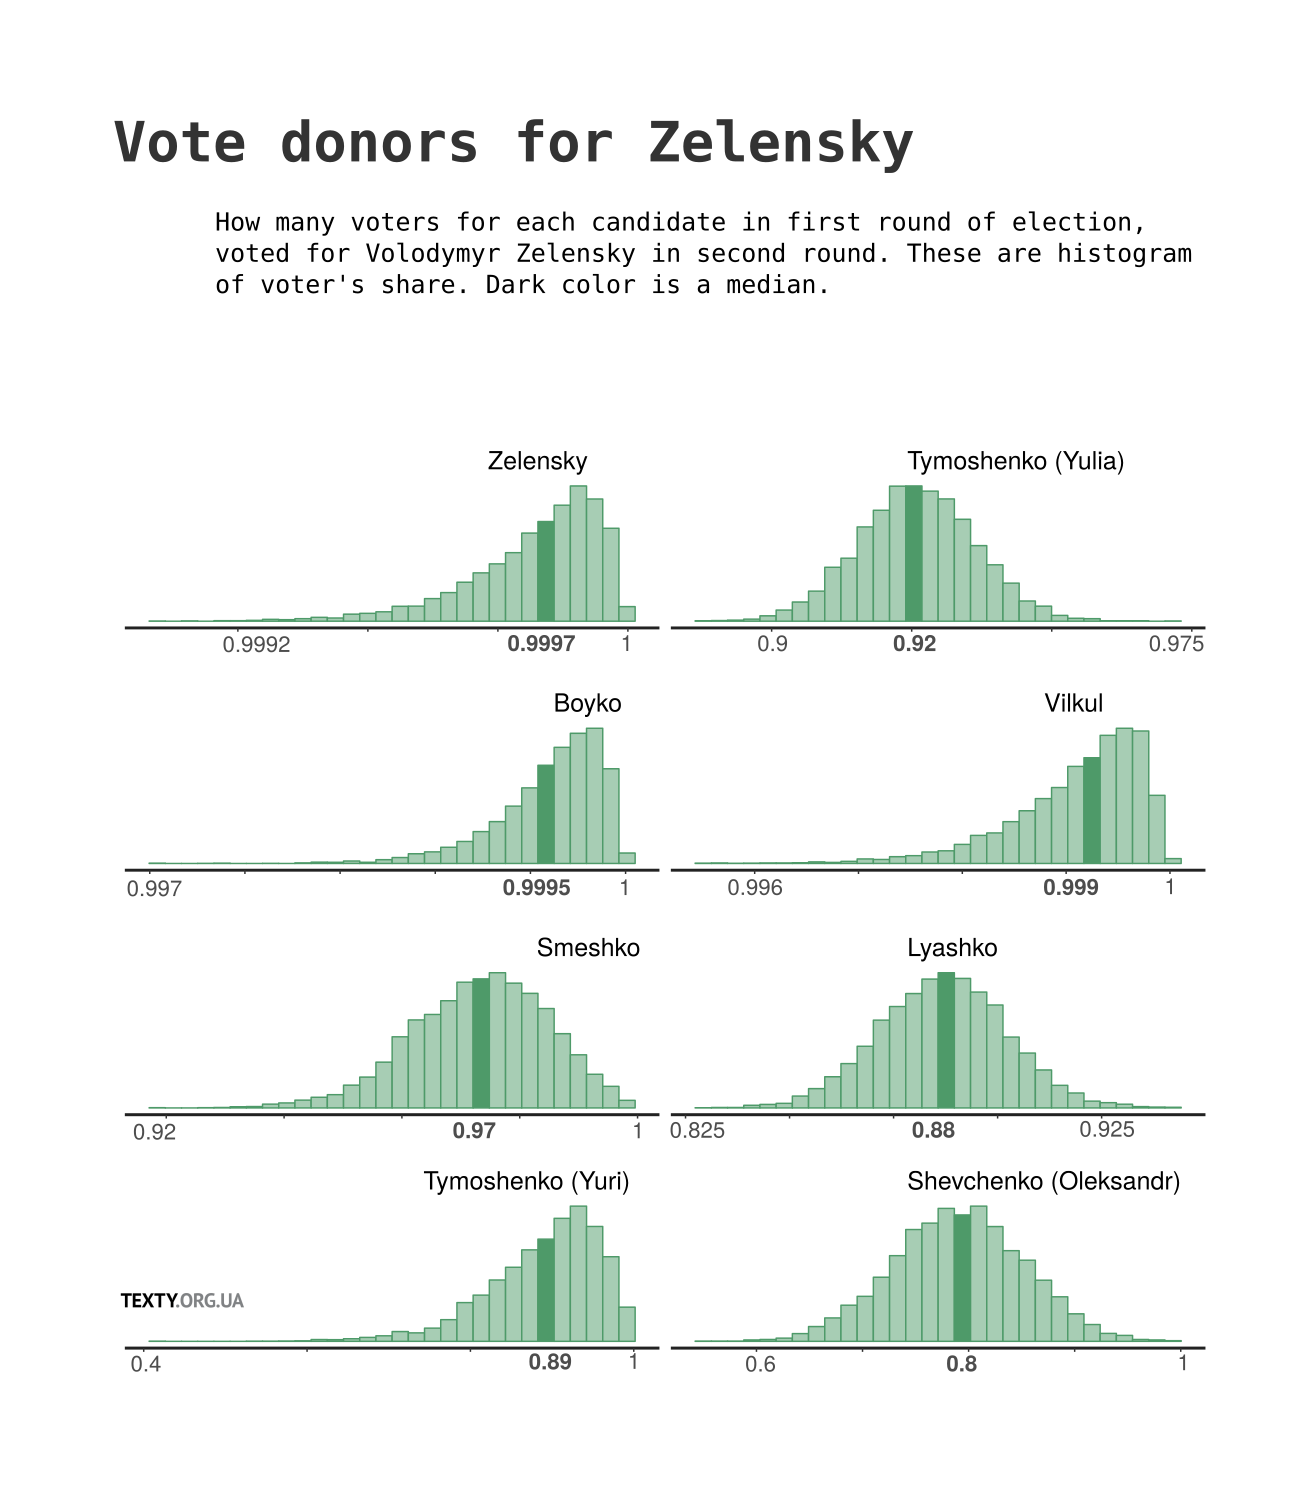
Zelenskiy’s major donors of votes
Using his “invisible candidate” strategy (of a presidential nominee whose true beliefs on most sensitive issues were almost impossible to define) Zelenskiy managed to gain the electoral support from voters of various candidates: about 90% of Yuliya Tymoshenko’s first round votes (the most significant contribution in absolute numbers), almost 100% of Yuriy Boyko’s as well as Oleksandr Vilkul’s votes, 97% of Smeshko’s votes, almost 90% of Lyashko’s electorate. Below is the table showing the final summary of votes' transmissions.
| First round candidate | How many voices migrated in the second round |
| Volodymyr Zelenskiy | ~5.7 million |
| Yuliya Tymoshenko | ~2.3 million |
| Yuriy Boyko | ~2.2 million |
| Ihor Smeshko | ~1.1 million |
| Oleg Lyashko | ~900,000 |
| Oleksandr Vilkul | ~780,000 |
| Yuriy Tymoshenko | ~100,000 |
| Oleksandr Shevchenko | ~80,000 |
Tabel 2, model of "migration of votes" from other candidates to Zelenskiy in the second round of elections
Please click the graph to see high quality picture
Caution: the results of our modeling should not be taken too seriously because there is no possibility to test them by additional methods – for example, by a post-election sociological survey. As it is known, all models are wrong but some of them are useful. The question still remains open whether our model is useful. To read about its technical part in more details – please visit the page with methodology description: https:/


